
Sturdy Statistics automatically structures your unstructured data, seamlessly unifying all your information into a scalable data lake that’s ready for analysis with SQL or your favorite BI tools.
The automatic structure allows you to query your unstructured documents using SQL, powers our state-of-the art explainable text classification, and enables our powerful search API.
After structuring your data, Sturdy Statistics stores it in a comprehensive data lake, alongside classification predictions, search ranking, and any structured metadata you choose to upload. With our data lake you can analyze all of your data – structured and unstructured – in one place, on equal footing, and with the tools you already use for data analysis.
Automatically Structures Unstructured Text Data
Companies today enjoy a great set of tools for analyzing structured data. However, the most essential and actionable insights are precisely where they are hardest to discover: in the unstructured data such as call transcripts, customer support cases, product reviews, or financial documents. Since this data is unstructured, however, it often goes unanalyzed. Sturdy Statistics has the unique ability to automatically convert unstructured data into a structured format. This format allows you to process unstructured documents if they were tabular, using the tools you’re already familiar with.
To see how this automatic structuring works, let’s see how it works with a dataset of financial documents. We uploaded earnings calls from a sample of large tech companies (AAPL, AMZN, GOOG, META, MSFT, and NVDA) from the past four years. The Sturdy Statistics model then automatically inferred the important topics in the dataset, and categorized each document according to its thematic content. We show a small portion of the resulting data below:
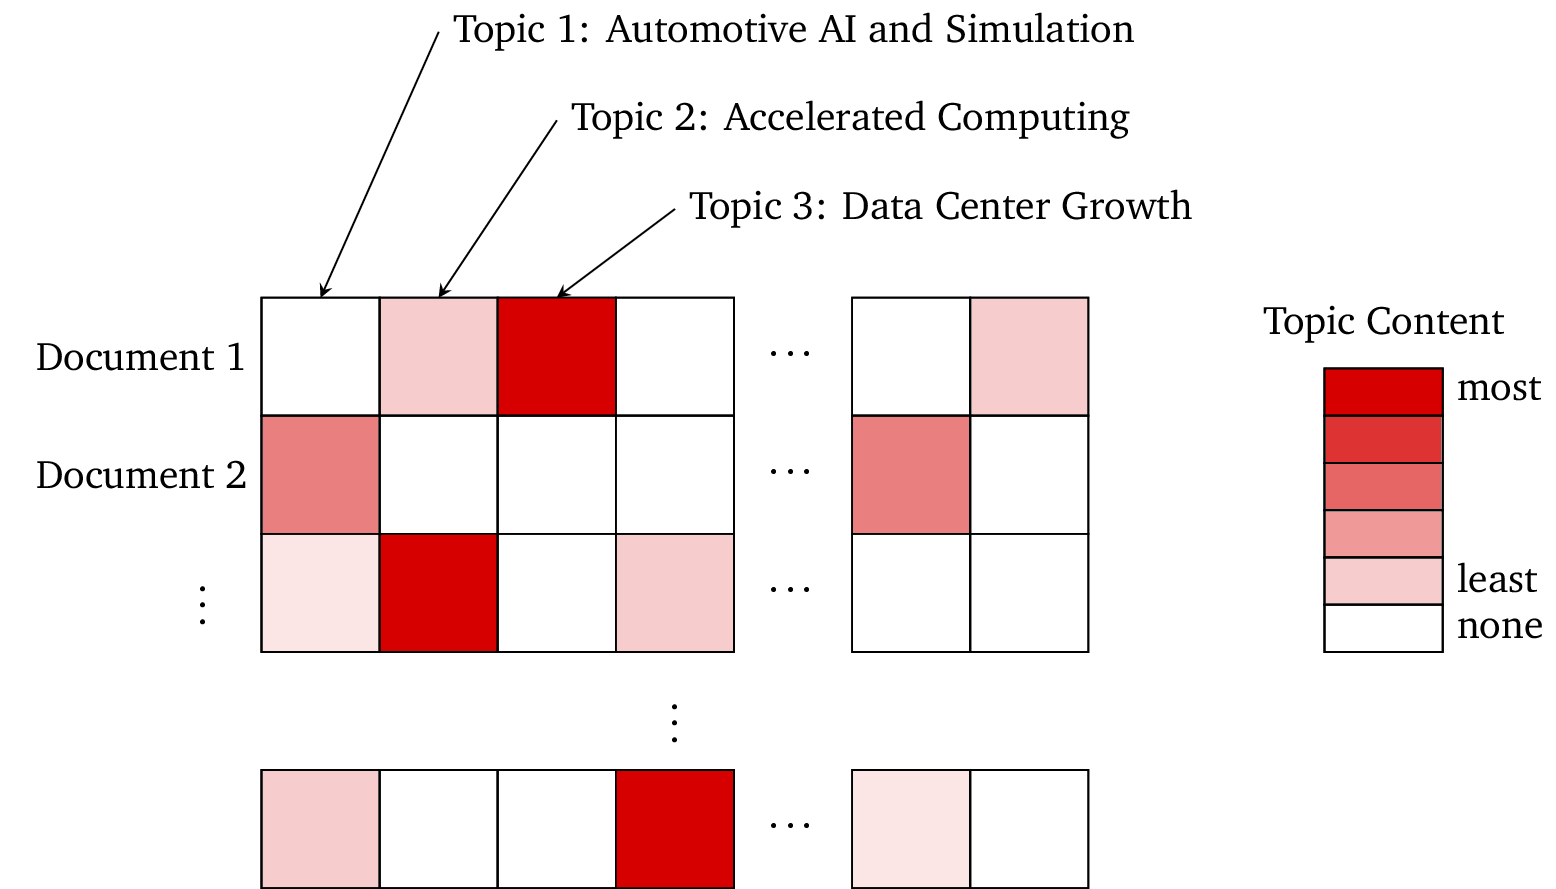
You can see that we have imputed meaningful topics with easily-interpretable names, and that each document can be easily understood according to its thematic content. Unlike LLM embeddings, each column in this representation corresponds to a meaningful, immediately interpretable concept, and most of the columns are zero. These properties greatly enhance the utility of our representation: because you can understand our features, you can use them directly, without needing to train a downstream machine-learning model. (Of course, our human-readable features also make excellent inputs to machine learning models if that is your goal.)
Related Links
However, we don’t only structure documents in this way. In the above example, we can see that Document 1 is primarily about Data Center Growth, but that it also touches on Accelerated Computing. We can inspect this document paragraph-by-paragraph and see where it mentions each of these topics. While each document typically covers several (and can contain many) topics, a paragraph typically only has one or two topics:

Since paragraphs are so sparse — with each containing just one or two topics — they behave extremely well for semantic search with our technology. (See a description of our search API here.)
Because of this close mapping from paragraphs to topics, we can easily retrieve example paragraphs for any topic. For example, the top paragraph containing the topics Data Center Growth and Accelerated Computing in the dataset is as follows (from Nvidia’s 2023Q2 earnings call):
Colette Kress: Thanks, Simona. Q1 revenue was $7.19 billion, up 19% sequentially and down 13% year-on-year. Strong sequential growth was driven by record data center revenue, with our gaming and professional visualization platforms emerging from channel inventory corrections. Starting with data center, record revenue of $4.28 billion was up 18% sequentially and up 14% year-on-year, on strong growth by accelerated computing platform worldwide. Generative AI is driving exponential growth in compute requirements and a fast transition to NVIDIA accelerated computing, which is the most versatile, most energy-efficient, and the lowest TCO approach to train and deploy AI.
Where we have highlighted the words most emblematic of these topics.
In similar fashion, we can split a paragraph into sentences and inspect each of their topics. Or, we can go in the other direction and look at sections, chapters, or even groups of documents. We can impute this thematic structure at any scale in your data. See the sections on our search API or our data lake for some examples of what you can do with this structuring.
Accurate and Explainable Text Classification
In addition to our signature text analysis,, Sturdy Statistics also performs text classification. Our proprietary classification algorithms excel precisely where most other classification models struggle: classifying long documents, with multiple categories, and few labeled examples. While these important aspects aren’t often emphasized in machine learning research, in our experience they are fundamental to the practical application of machine learning.
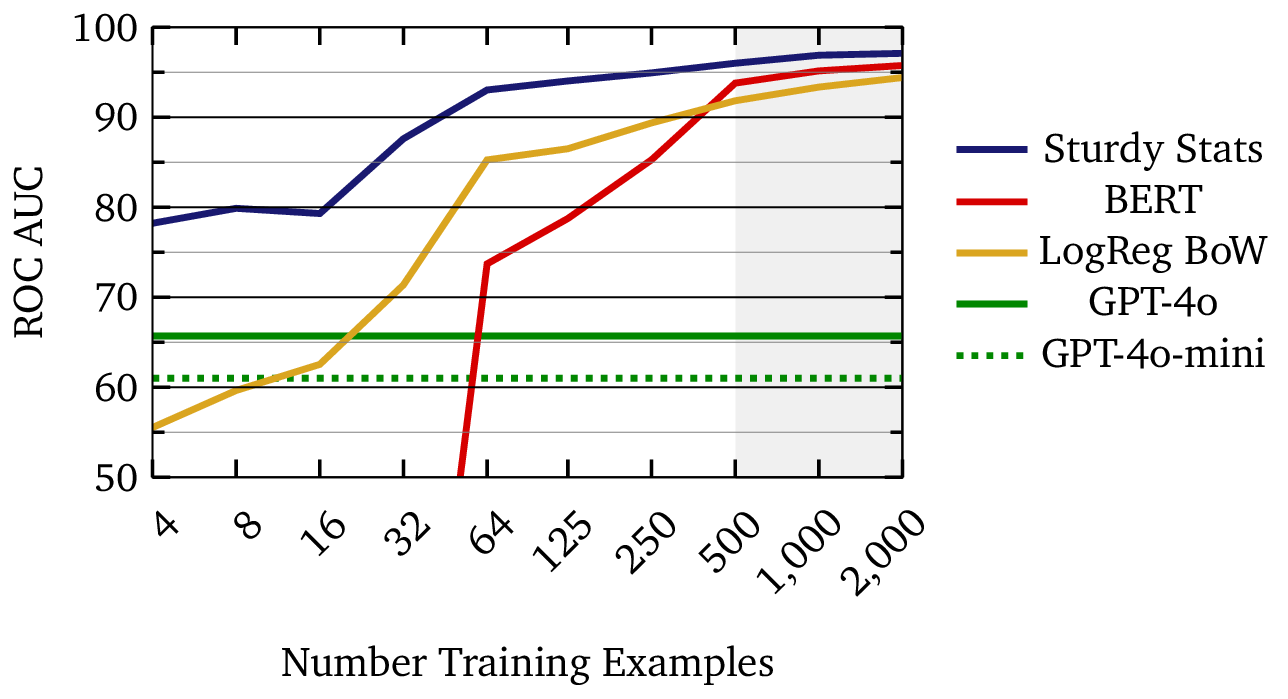
The figure below compares learning curves for three different document classification technologies. The learning curve for a machine learning model demonstrates how the model’s performance improves as it trains on more data; in effect, it shows how well the machine learning model actually “learns.” In this example, the Sturdy Stats model reaches a score of 90% with just a few dozen examples; a single person could curate such a dataset in under an hour. On the other hand, the BERT and logistic regression models require roughly ten times as much data (∼500 examples) to reach the same performance. Large, purpose-built datasets are time-consuming and expensive to curate; in our experience, data availability is the limiting factor for most industrial machine learning applications. Using an AI technology which can operate with 1/10th as much data provides a tremendous competitive advantage.
One of the most distinctive features of our classification models is their fundamental explainability: users of Sturdy Stats models are able to understand precisely how a model arrives at each specific prediction. This is extremely unusual in text classification, except for the simplest models such as logistic regression; typically, AI “explainability” involves significant post-processing and interpretation of the prediction, very often using another (and usually opaque) AI model to aid in the analysis. The extreme transparency of Sturdy Stats models builds trust with users, and might even be required in sensitive applications like legal, medical, or financial decision-making, where incorrect or biased classifications have significant consequences.
The example below shows the explanation of a correct prediction from our model. The input document was a patent description, and the classification task is to predict the category (known as the CPC code) for the patent. In this case, our model correctly predicted that the patent belongs in the “construction” category. We can inspect which sentences, and which words within those sentences, most contributed to the prediction.
The figure shows that 4 out of 159 sentences in the description contributed substantially the prediction; interestingly, most of these are contiguous, and center on the “SUMMARY OF THE INVENTION” section heading. Thus, we can see that the model has indeed surfaced the “right” portions of the document for the task. (At least, the same portions I would have looked at if given this task!) We can also see that the words wellbore, casing, drilling, bonding, and adhesion contributed appreciably to the prediction, whereas words like pressure and temperature do not. This makes sense in light of the fact that other patent categories, such as “Physics” or “Engineering” might also uses these terms. The words wellbore and cement are more specific to construction. These results show that the model has not only made a correct prediction, but that it has done so for appropriate and understandable reasons.
Related Articles
The text classification API offers yet another means to automatically structure documents: first, by categorizing them, and next, by ranking the portions most relevant to each category. The structure imputed by our classification API works in tandem with the structure inferred by our text analysis API.
For more information, see our detailed description of our text classification feature.
Works Even with Tiny Datasets
Sturdy Statistics uses special, sparse-coding priors which strongly separate the signal from the noise in your data. Removing irrelevant information allows our models to make more efficient use of labeled data, focusing it on the only the relevant portions of the data. This enables Sturdy Stats models to train more efficiently, extracting more, and more valuable, information from your data.
This plot compares the Sturdy Statistics regression model against a typical L2, or “ridge” regression. The L2 has been specifically tuned for this problem by a data scientist, while the Sturdy Stats model has been run straight “out of the box,” precisely as a user of our API would. The sample problem shown here has two solutions: some parameters (shown in gray) should be exactly zero, while others (shown in red) should be exactly 5. These correct solutions are marked with gray and red lines. Each row shows results from training the models on progressively larger datasets: the Sturdy Stats model performs far better on 10 data points than ordinary regression does on 45! And this is despite the ordinary model being tuned by an expert, while the Sturdy Stats model is self-tuning and fully automatic.
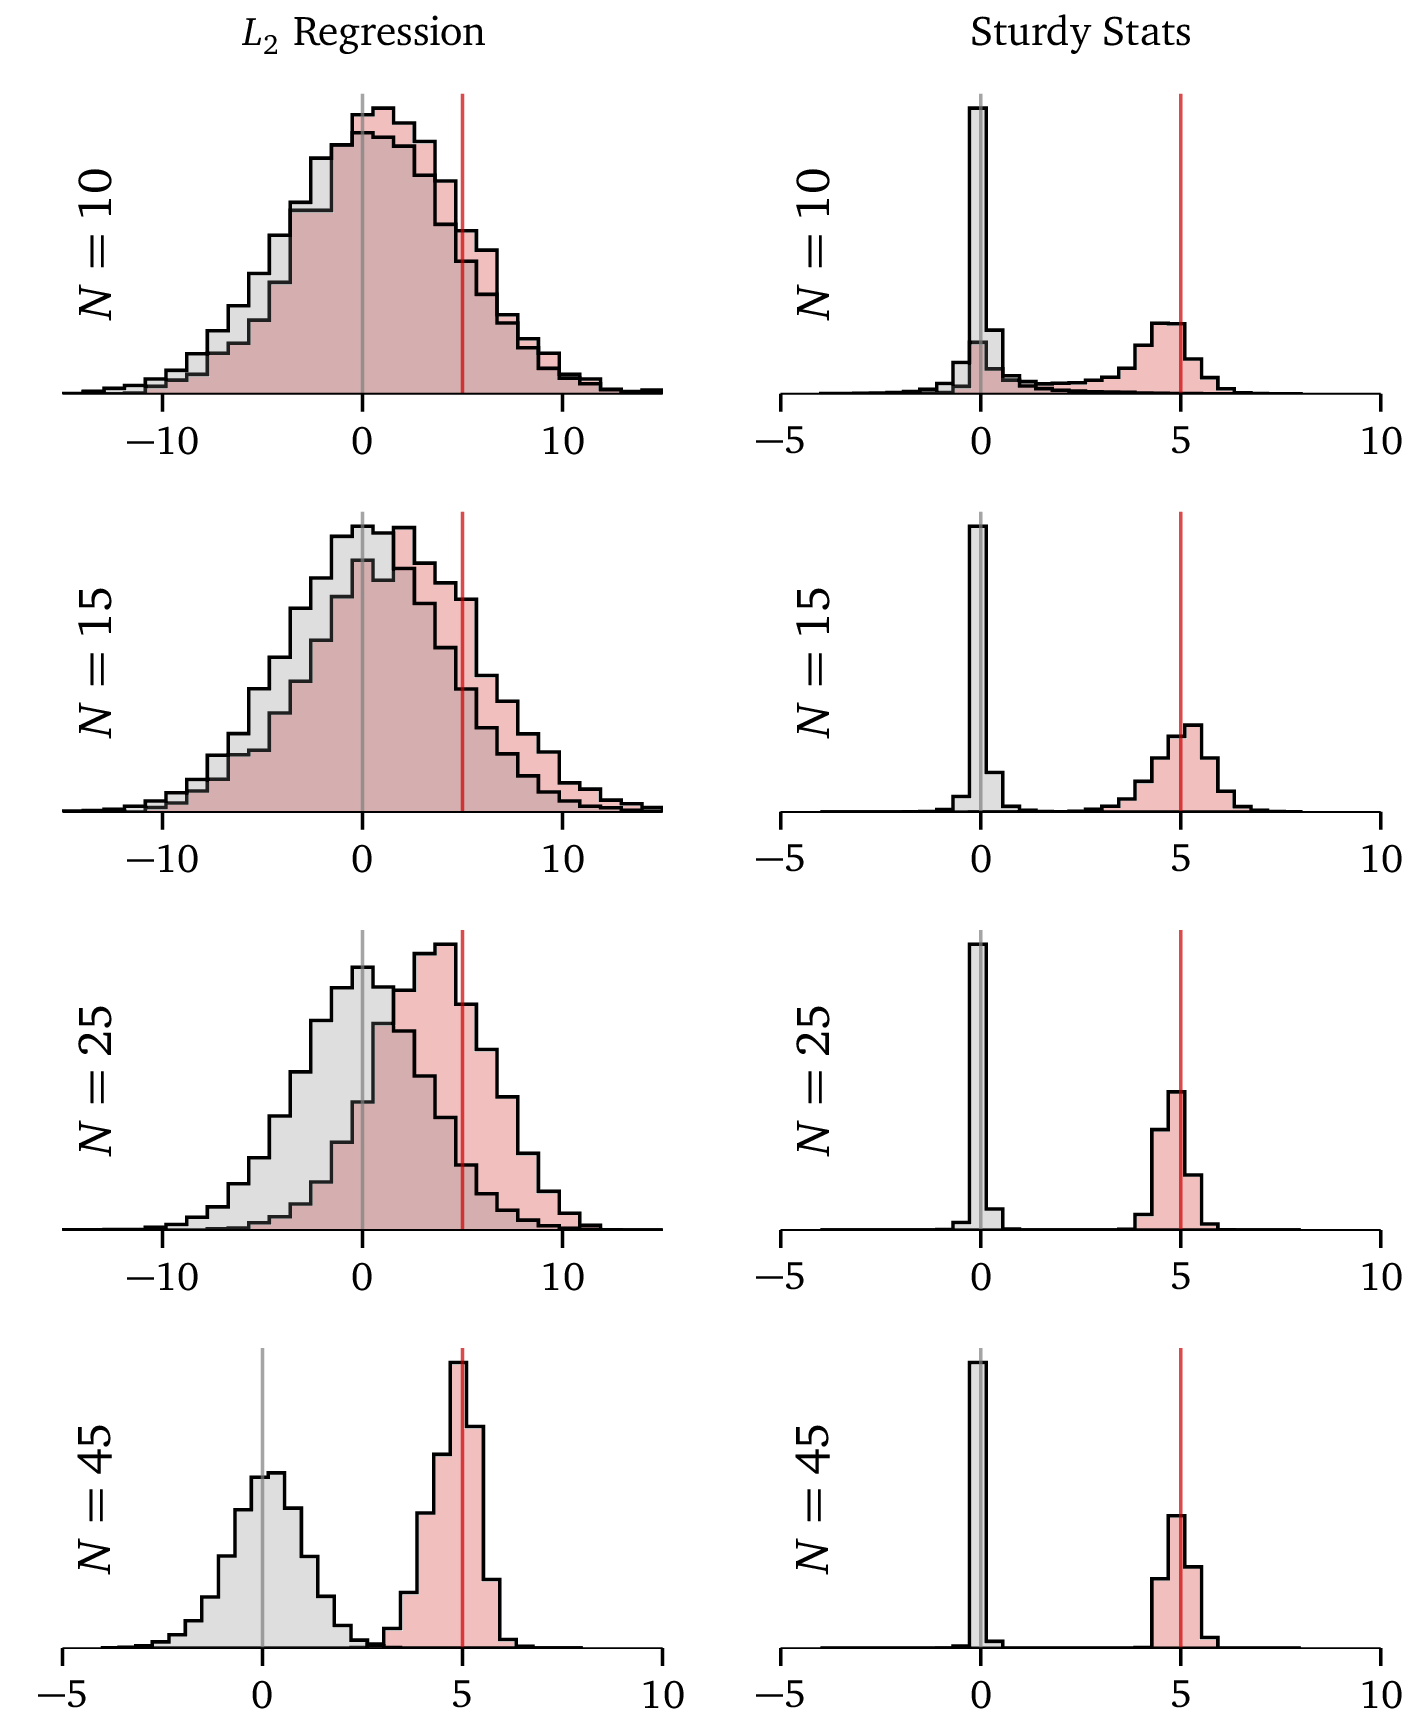
While the ordinary L2 model slowly converges to the correct solution as we add more data, the Sturdy Stats model locks onto it immediately and becomes quite confident, even with just 15 data points. With features like this, Sturdy Statistics automates much of the work of a data scientist. See the detailed description here for more information about this technology.
Search
We also provide an advanced search API for any indexed dataset. Like other search offerings, our API supports exact-match rules for text and SQL-based filtering for metadata. However, our search algorithm also benefits from the structure and thematic content inferred by the Sturdy Stats text analysis algorithm. Our search provides excellent results out of the box, without any added work required to fine-tune embeddings or to train a second ranking model.
Under the hood, our semantic ranking works differently than the more common semantic search based on neural embeddings. Returning to our dataset of tech company earnings calls, let’s say we submit a search query for the war in Ukraine. Our model maps this unstructured search query into our semantic topic space, identifying the following topics connected to the query:
- Global Economic Challenges,
- Foreign Exchange Impact,
- Navigating Economic Uncertainty,
- Inflation and Energy Costs, and
- Supply Chain Disruptions
Even on its own, this results gives insight into how American tech executives see the Ukraine war affecting their business. Our search algorithm then compares this thematic content to our already structured set of documents, paragraphs, sentences and words in order to return the optimal semantic ranking. This structure also enables us to extract the paragraphs, sentences, or even words which are most pertinent to the search query. In the case of our example dataset, the highest-ranking sentences are:
AMZN 2023Q1: I would say I think for any leadership team, each era is different, and it’s often meaningfully impacted by what’s happening around you. And I think that if you look at the last couple of years with things like the pandemic and the labor shortage in 2021 and the war in Ukraine and inflation and uncertain economy, good leadership teams look around and try to figure out what that means and how they should adjust their businesses.
META 2023Q3: In terms of the Q2 revenue acceleration, I’d highlight there are few factors driving that. The first is, frankly we’re lapping a weaker demand period, including the first full quarter of the war in Ukraine and the suspension of our services in Russia.
Related Links
When the search term is common, our combination of exact match scoring with semantic ranking automatically produces a custom two-phase ranking search algorithm. With common keywords, the exact match scoring produces a large set of candidate documents; our semantic scoring then re-ranks the results according to the semantic content in these documents. Typically two-phase ranking requires either:
- An out of the box solution that is not optimized for any specific application, or
- Extremely labor-intensive fine tuning and maintenance on a custom dataset.
Because each Sturdy Stats index is trained exclusively on your data, this second phase ranking mechanism is automatically optimized for your particular application: there are no global, hard-coded rules expressing someone else’s assumptions about your data, and no manual tuning or intervention is required on your part.
Our search algorithm also provides a tremendous advantage when the search term is rare. With rare keywords, our topic search operates like a fuzzy match engine: even if no documents match the query exactly, our engine surfaces examples based on the query’s semantic mapping. This fuzzy matching enables users to enjoy advanced semantic ranking, even when then have drilled down deep into their datasets with any number of filters. With other search algorithms, restrictive filters limit the dataset too much and prevent the ranking from working properly.
Comprehensive Data Lake for both Structured and Unstructured Data
Sturdy Statistics combines all of our automatically-imputed thematic structure, classification predictions, search rankings, and any structured data you already have into one unified data lake. This enables you to query all of these results, in one place, with a unified SQL syntax.
With Sturdy Stats, you can put your unstructured data on exactly equal footing with your structured data, and even analyze it with the same set of tools!
Related Articles
Let’s say we want to build a RAG application on top of our dataset of tech earnings calls, and we want to know how Nvidia and Alphabet are each discussing Automotive AI. With one SQL statement we can combine a metadata filter on the company name and a thematic index on the document content. We can then retrieve the top-matching paragraphs and send them to an LLM for summarization. This is what we find:
(topic="Automotive AI and Simulation") AND (ticker="GOOG")This theme centers on the strategic integration and advancement of Google’s generative AI and cloud services within various sectors and partnerships. Google is enhancing its product leadership through collaborative efforts, particularly in sectors like automotive, e-commerce, and education, by leveraging technologies such as Bard and Gemini to improve user experiences, efficiency, and innovation. Major initiatives highlighted include partnerships with companies like Porsche and Mercedes-Benz to enhance in-vehicle digital experiences, as well as the utilization of AI tools in Workspace and data analytics to optimize operations and customer engagement.
(topic="Automotive AI and Simulation") AND (ticker="NVDA")This theme centers around NVIDIA’s significant advancements and strategic positioning in the realms of artificial intelligence, automotive technology, and the development of its Omniverse platform. NVIDIA has reported robust revenue growth, particularly in its automotive sector, driven by AI automotive solutions and the rollout of its DRIVE platform, which supports automated and autonomous vehicle technologies. Partnerships with companies like Mercedes-Benz and Jaguar Land Rover exemplify NVIDIA’s innovative approach to integrating software-defined technologies into modern vehicles, thus transforming the automotive sector into a technology-driven industry.
At least in this dataset, we can see Nvidia more often discusses autonomous vehicles, while Google discusses technologies for in-vehicle digital experience and for improving operations efficiency.
But let’s say we don’t want to use an LLM; we want structured data to do quantitative analysis! Easy – we can quantify how often each company mentioned this topic by quarter as follows:
 SELECT ticker,
        quarter,
        SUM(sum_topic_counts["Automotive AI and Simulation"])
          AS occurrences
 FROM doc_meta
 GROUP BY ticker, quarter
Or let’s say we want to perform a regression to see which topics correlate with stock price movements. You can fetch the data as follows, and analyze it to your heart’s content:
 SELECT ticker,
        quarter,
        (day_end_price - day_begin_price) / (day_begin_price)
          AS price_delta,
        sum_topic_counts
 FROM doc_meta
Sturdy Statistics opens up all of your data for comprehensive analysis. Let us help you uncover the insights hidden in your unstructured data!