Step 1: Create an Account or Sign In
To create an account, you can follow our account creation walkthrough. After you sign in, you should land on your organization management page.
Step 2: Create a Report.
On the navbar, select the tab that says Create.
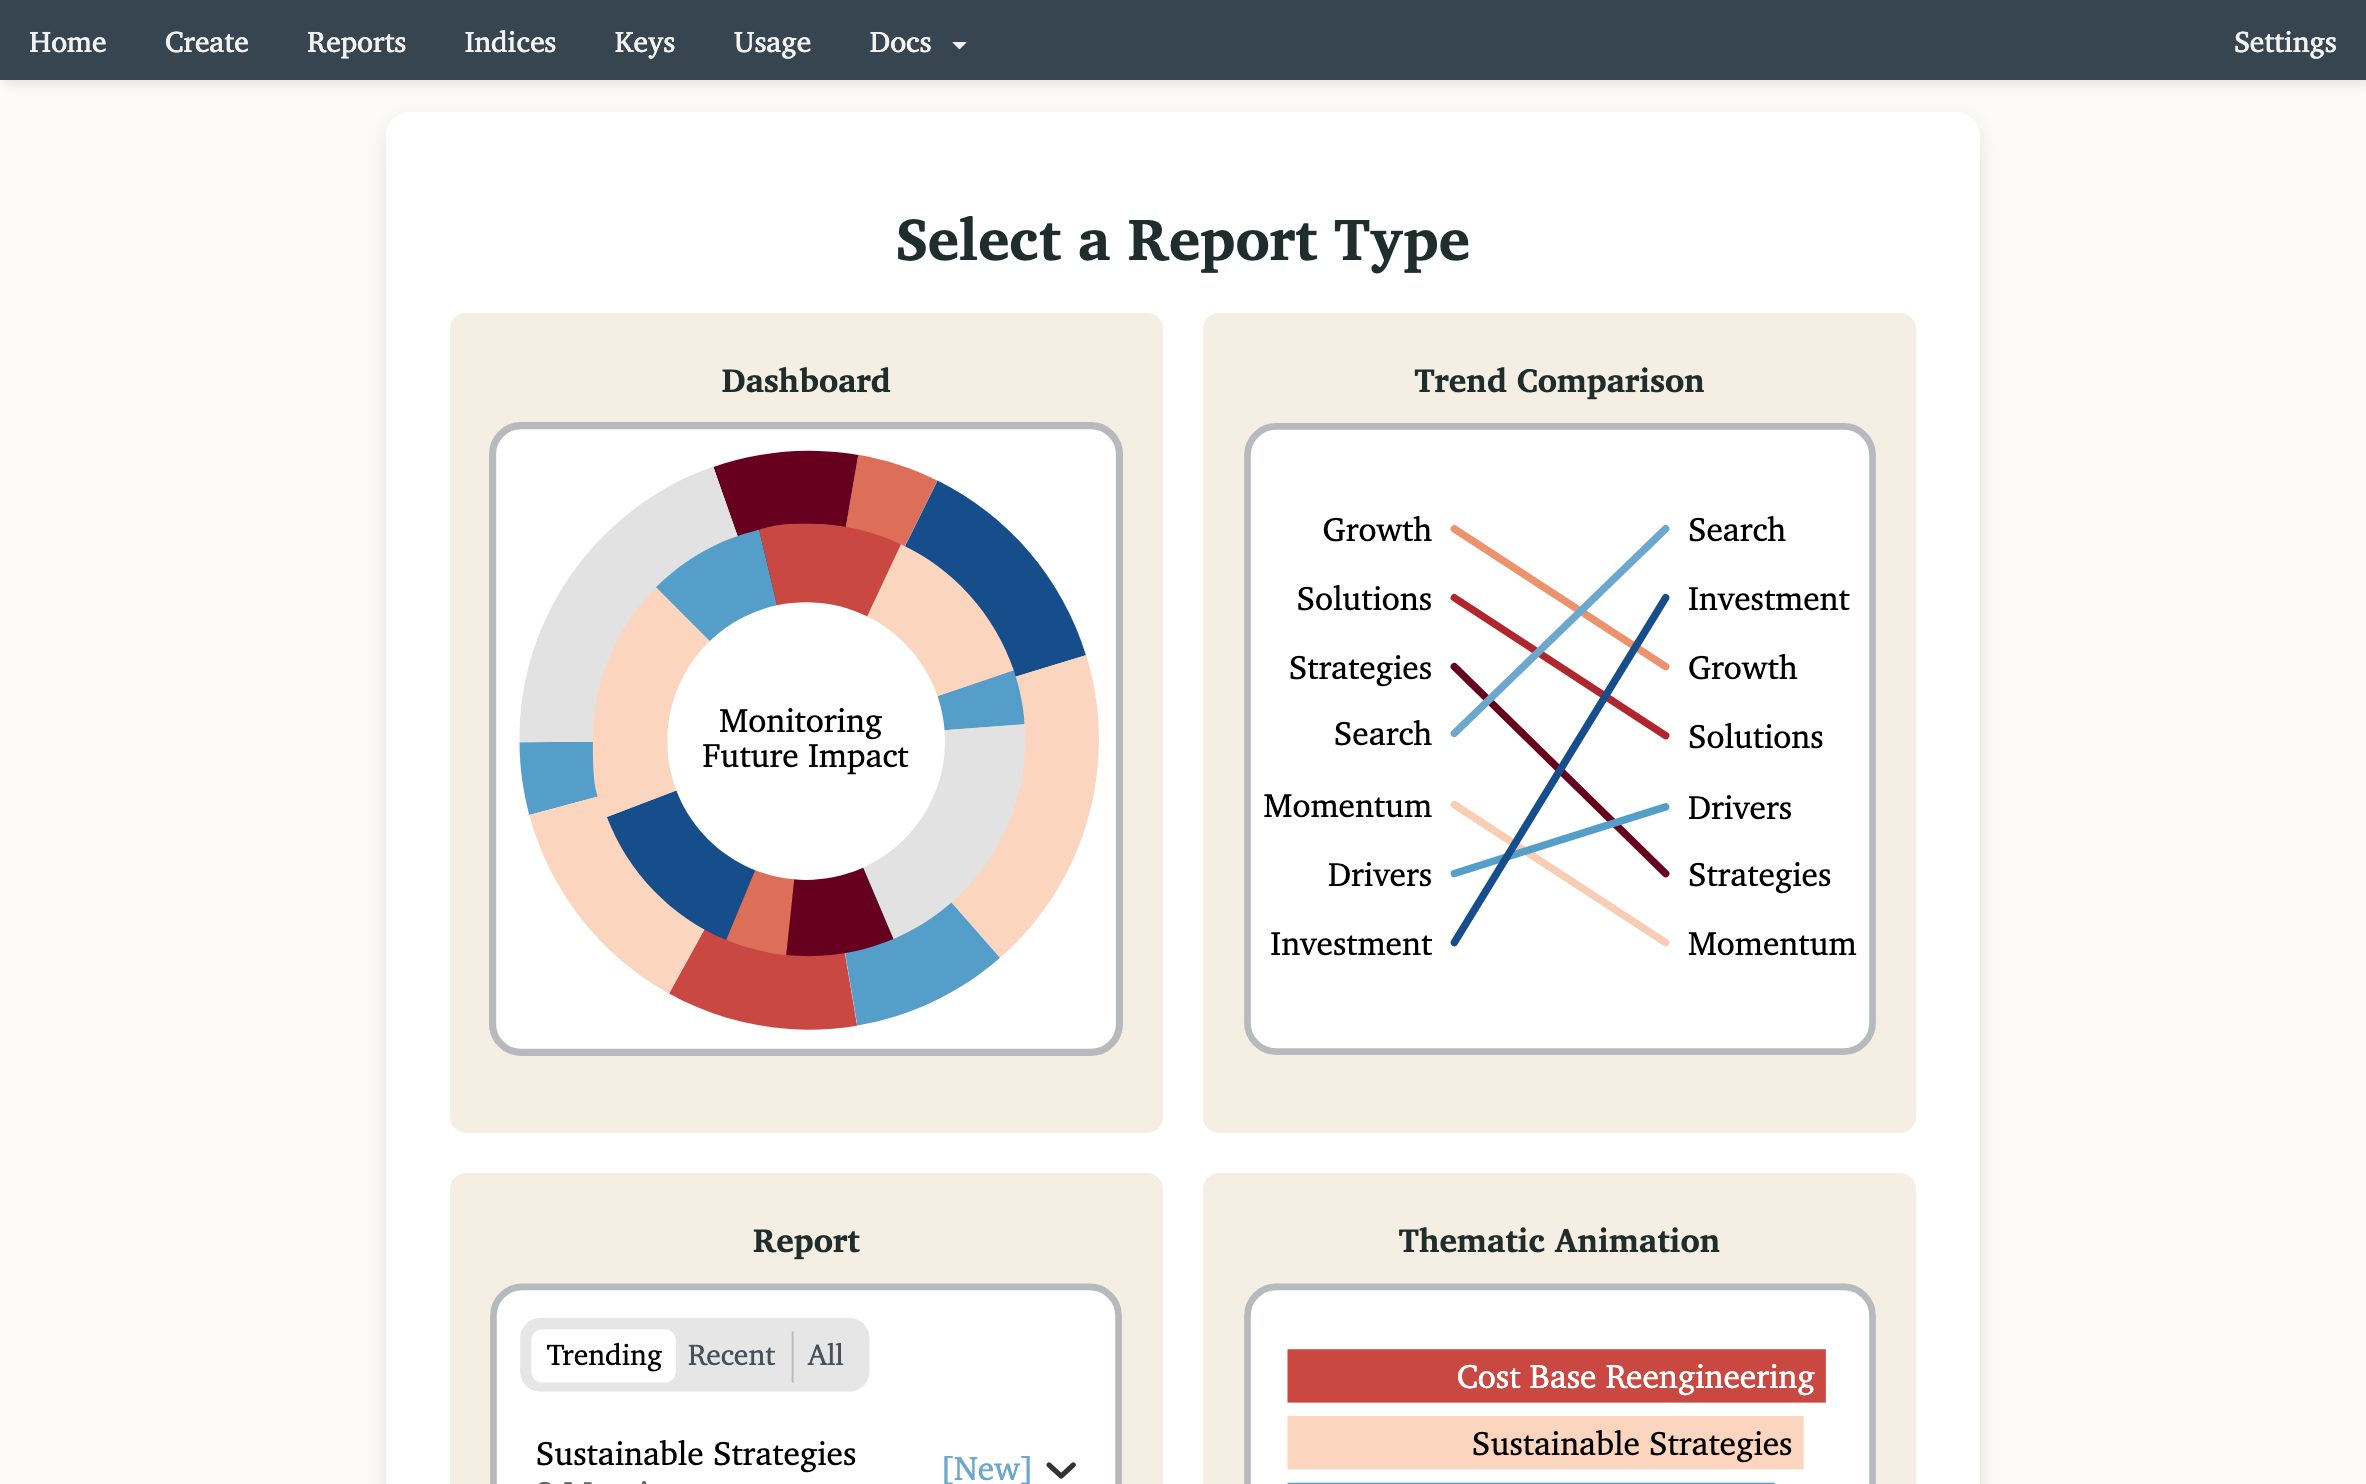
Step 3: Select a Report Type
You will be presented with 4 distinct report types. For product reviews, we recommend creating a Dashboard.
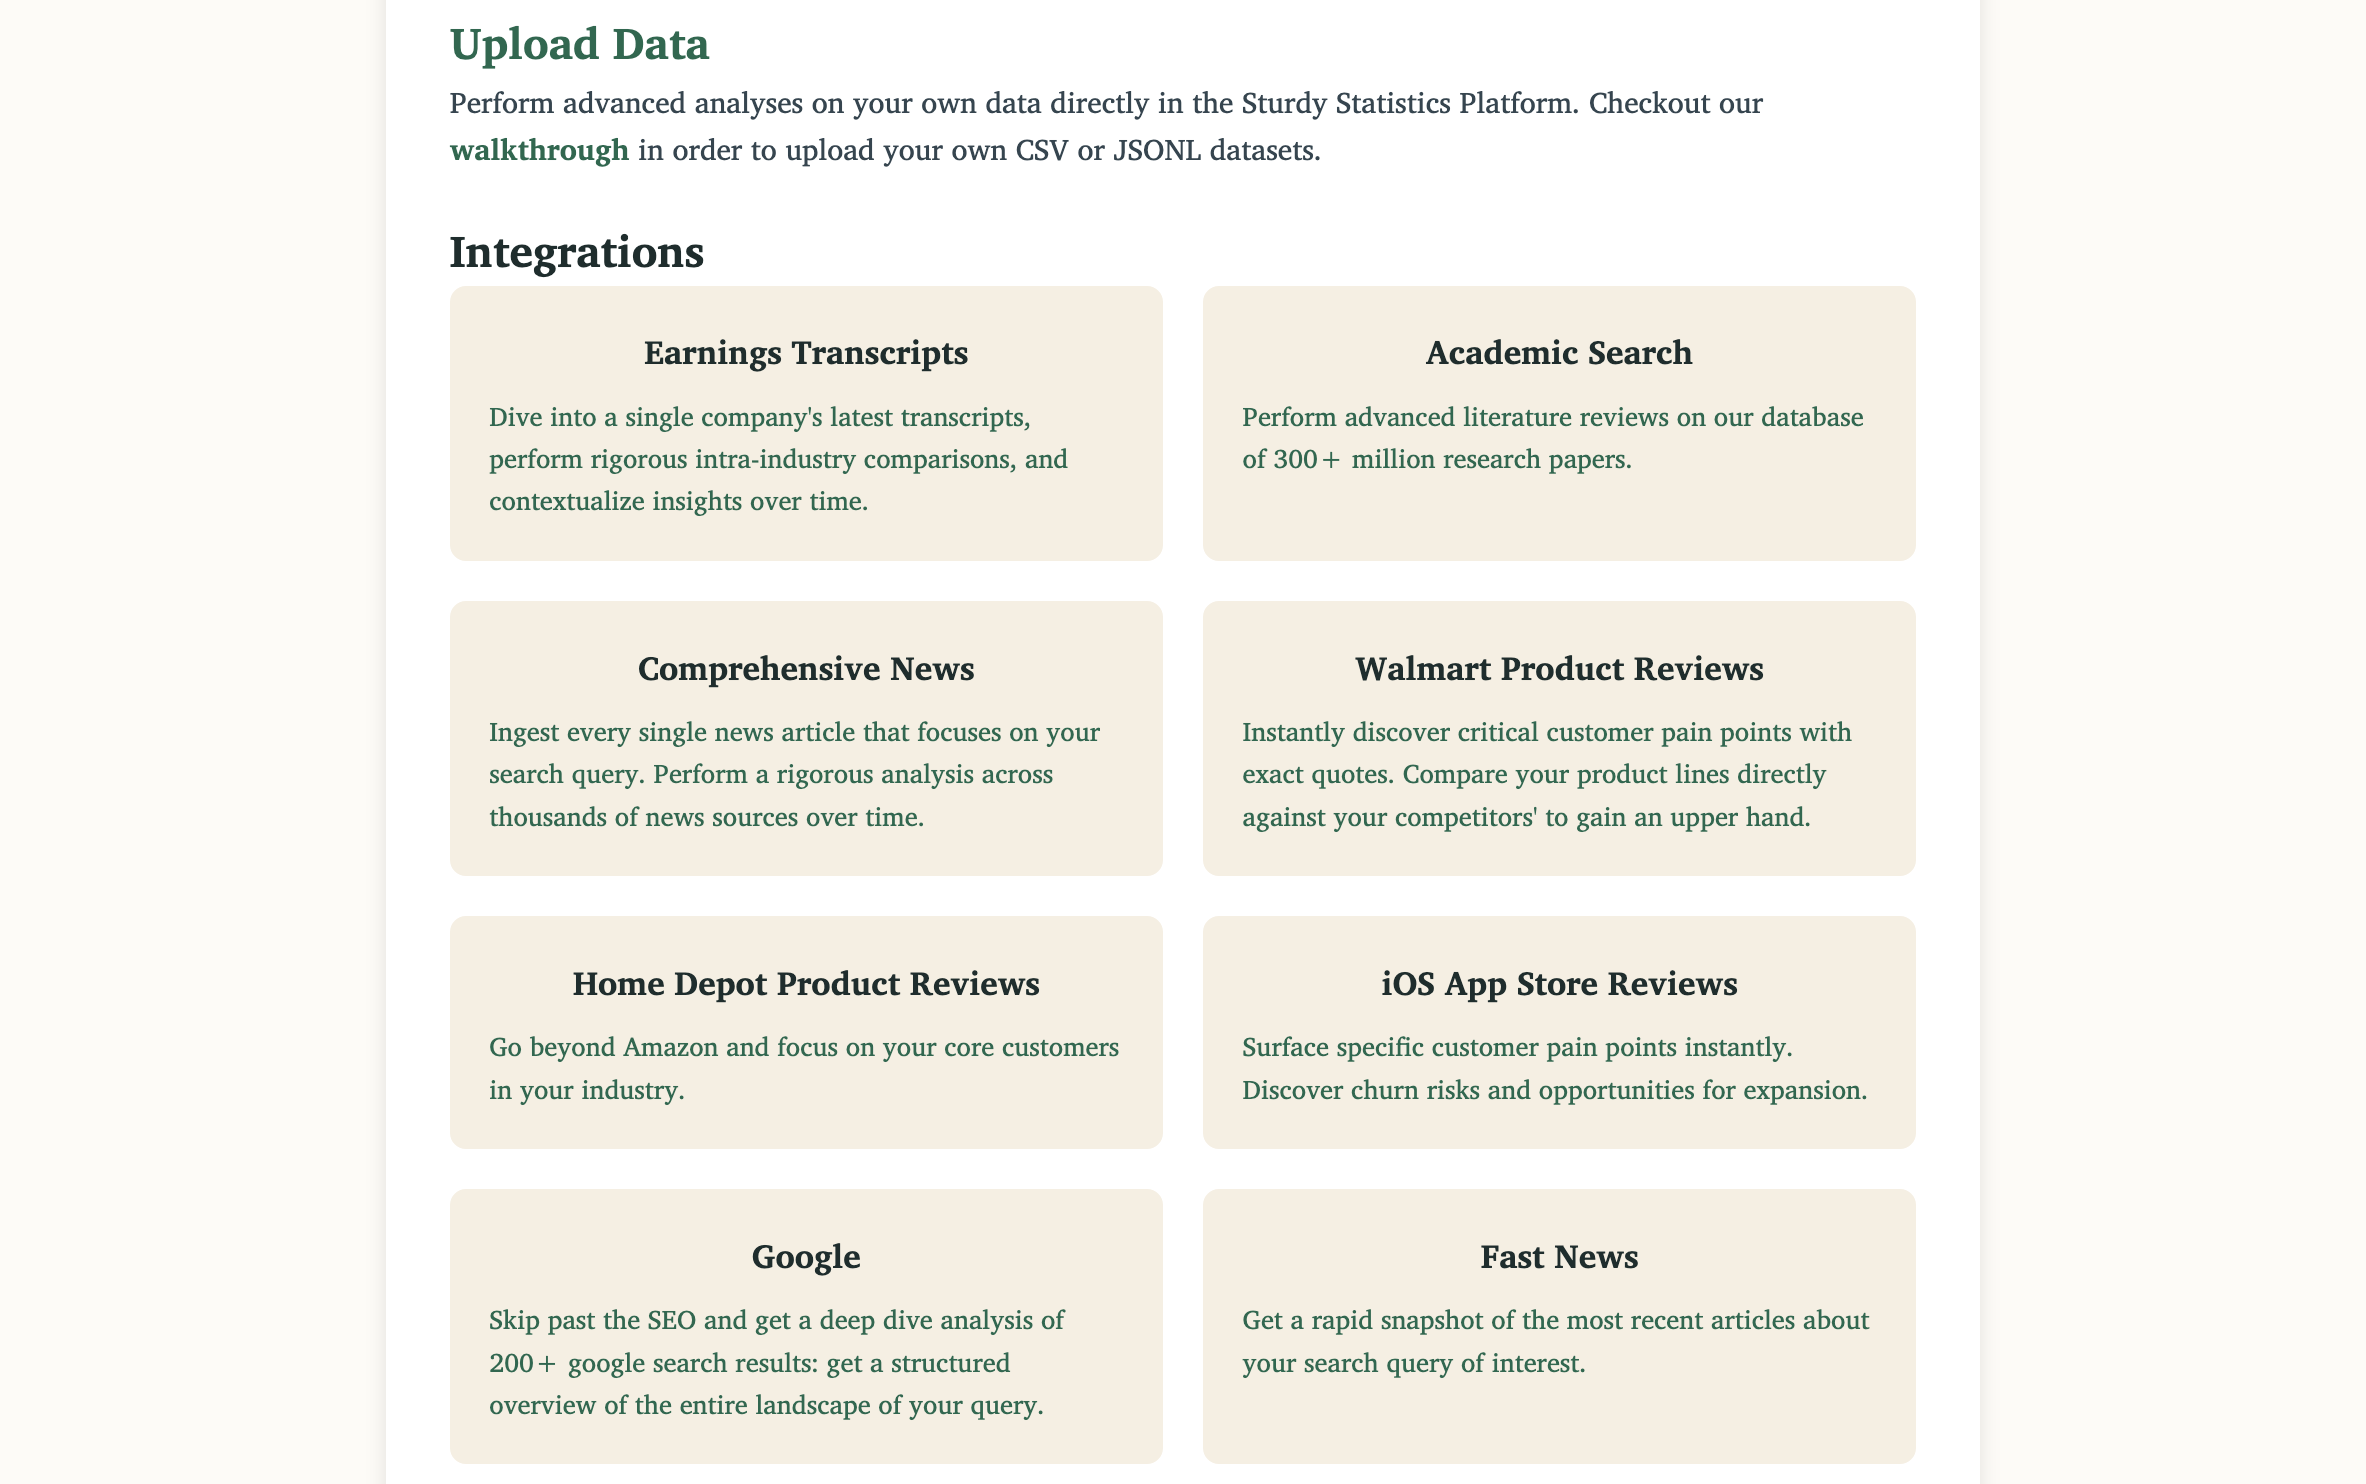
Step 4: Select an Integration
After selecting your report type you will have a number of input options. For this walkthrough, select Home Depot Product Reviews.
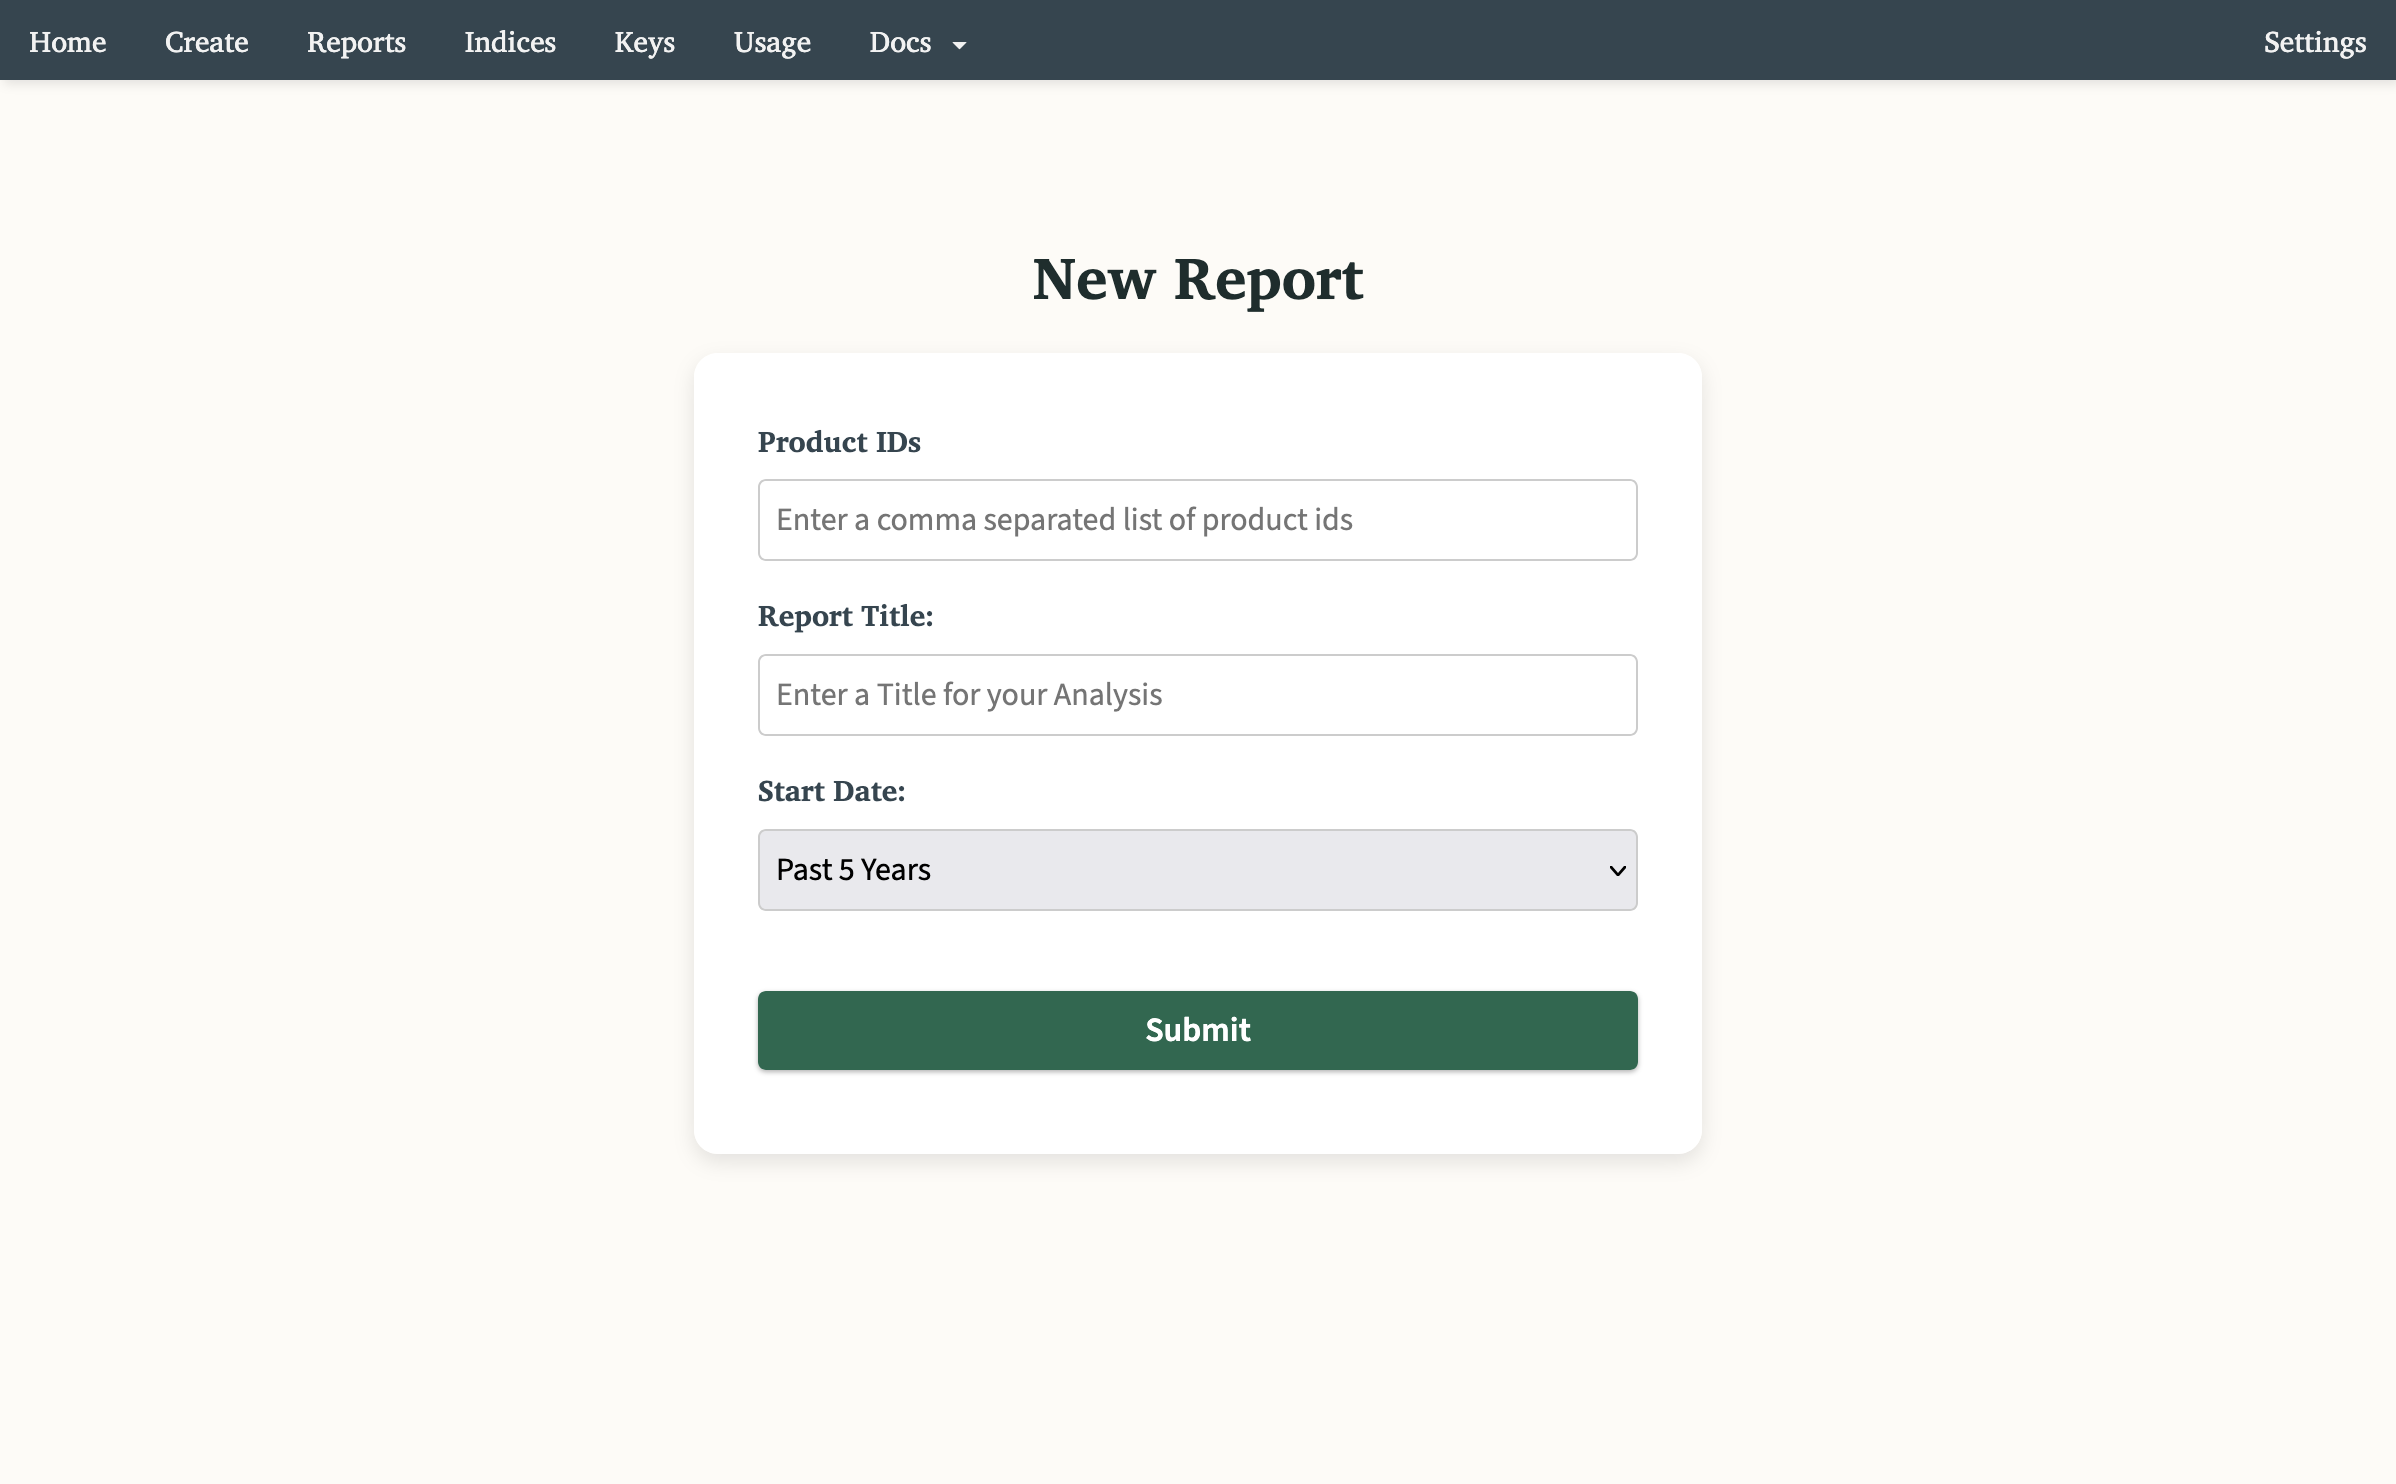
Step 5: Report Information
You will land on a page allowing you to specify your report name and products IDs. In the next steps, we will walk you through how to acccess Home Depot product IDs.
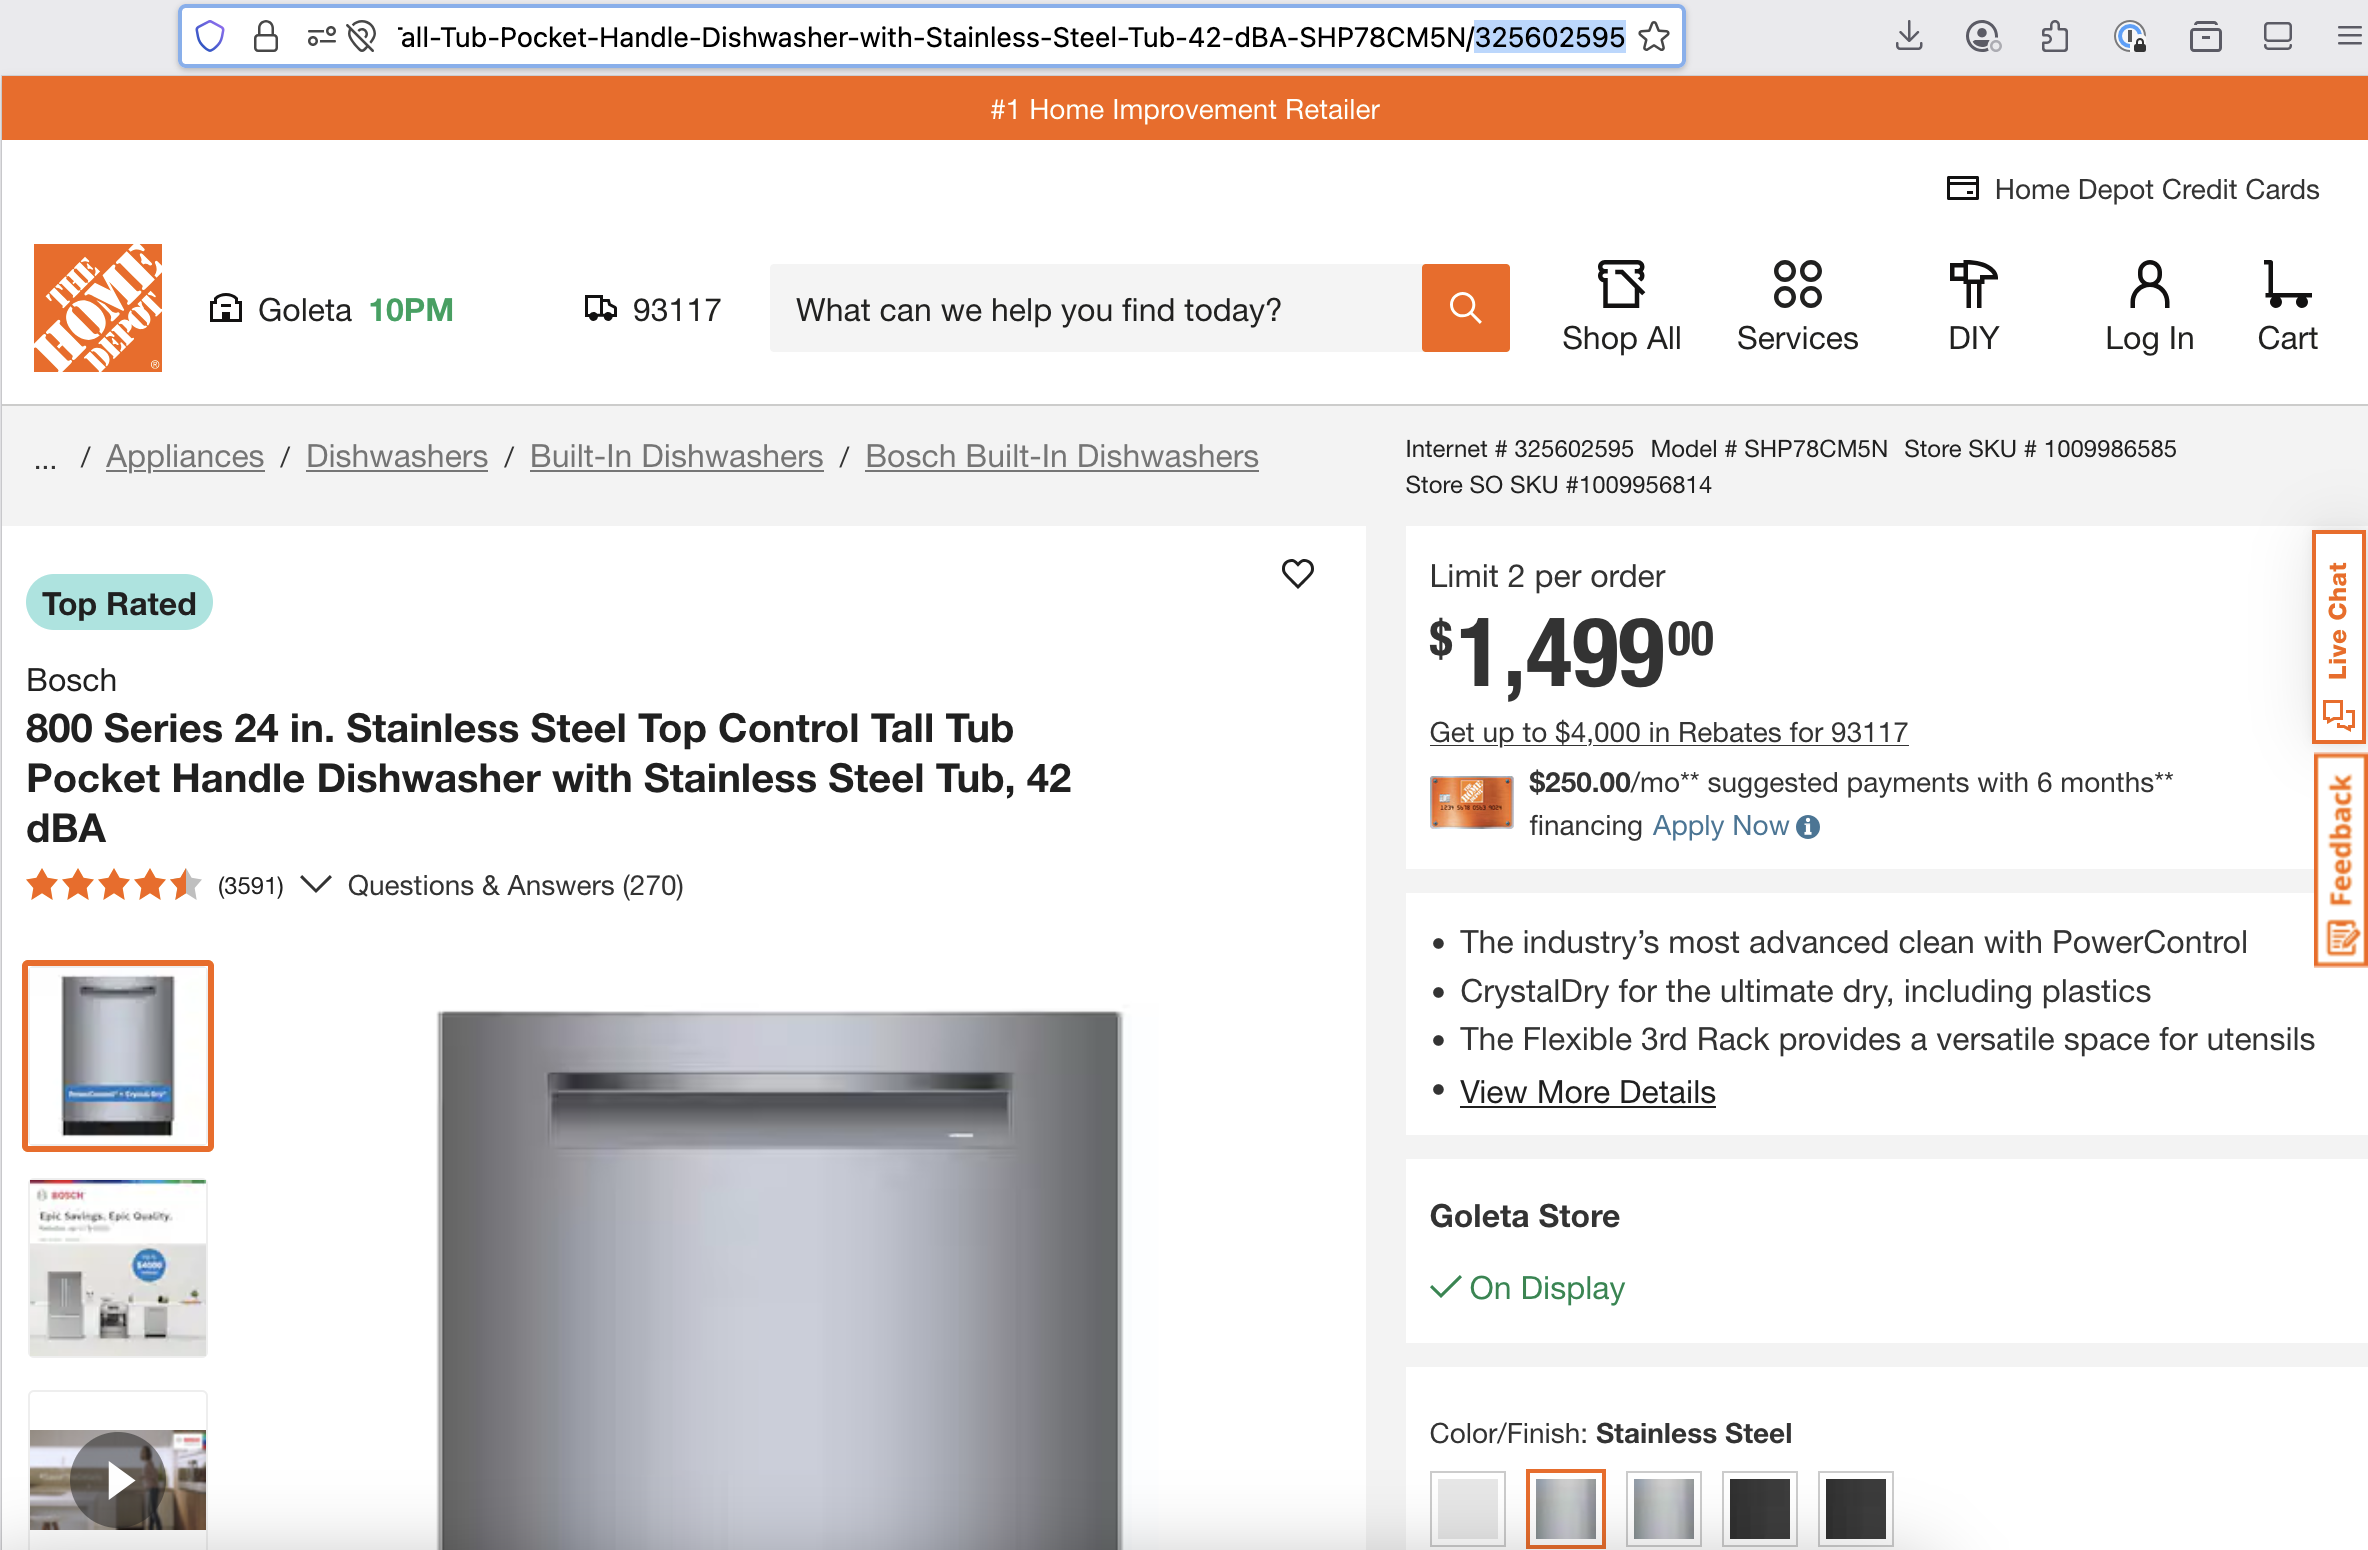
Step 6: Retrieve Product IDs
Go to the Home Depot product page for any products whose reviews you want to analyze. The product ID is the numerical code at the end of the URL (highlighted in the images below).

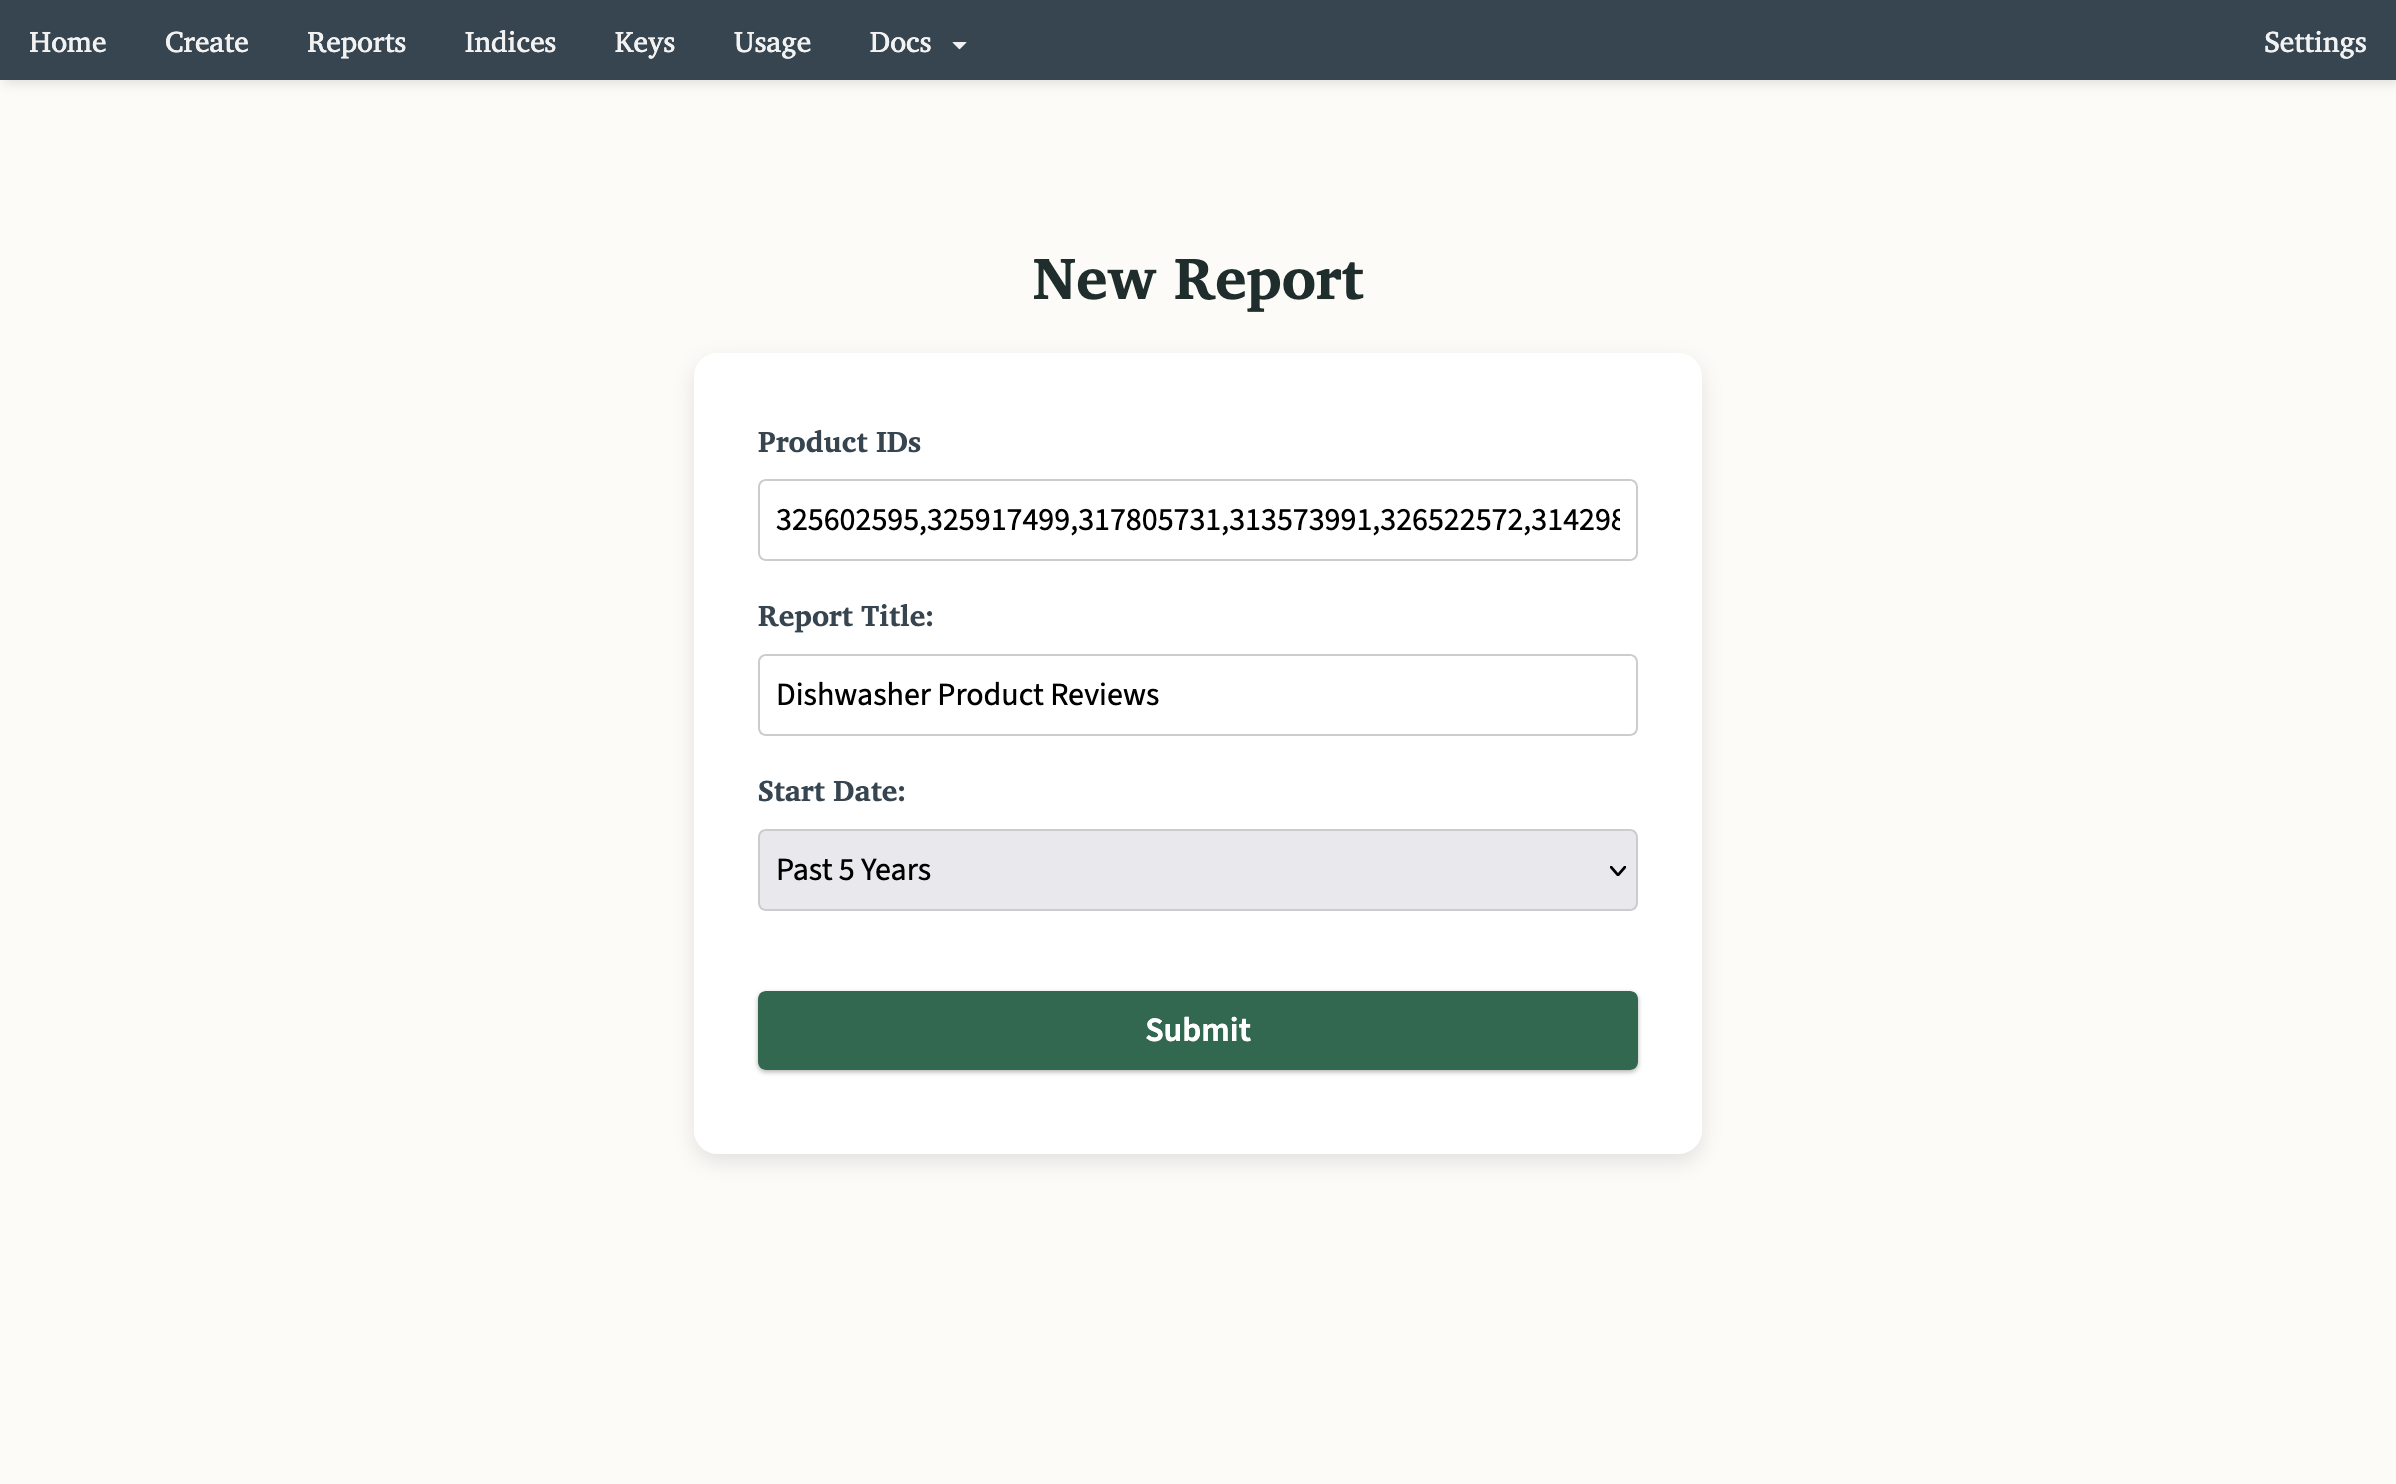
Step 7: Enter the Product IDs & Kick off the Report
Paste the product ID from step 6 into you report creation page. You can create a report with just one product ID or multiple separated by commas.
Once you have entered all the product IDs, you can click the Submit button to kick off the report.
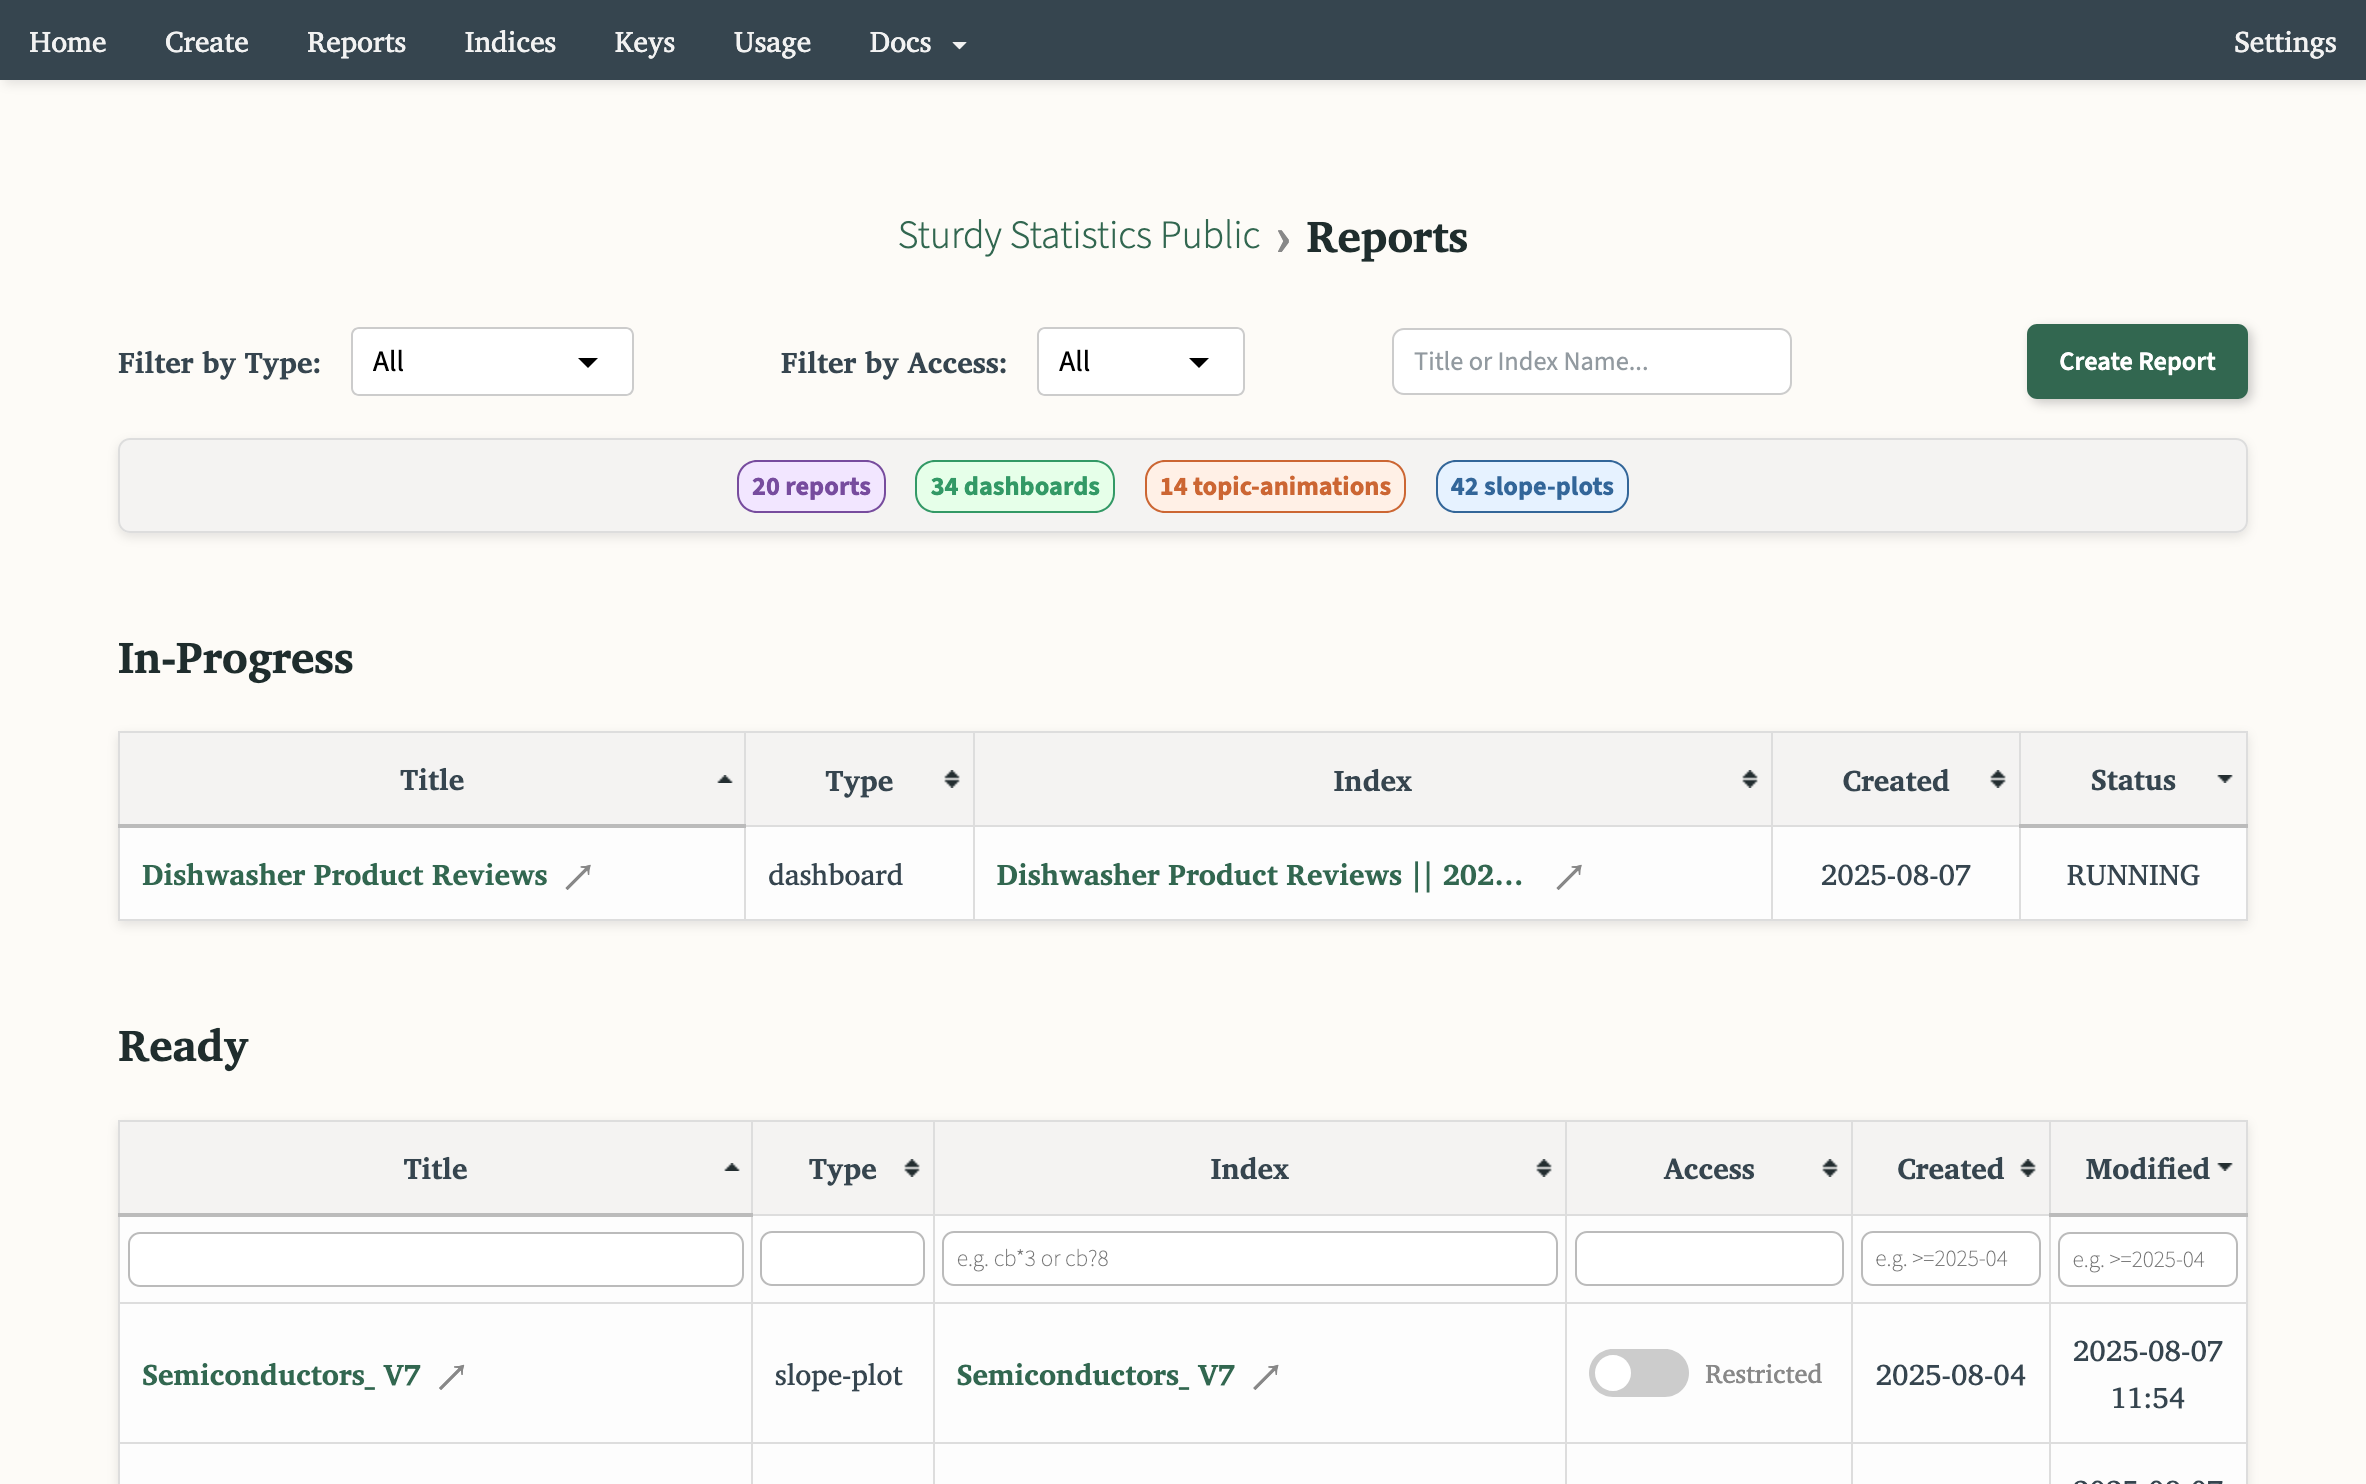
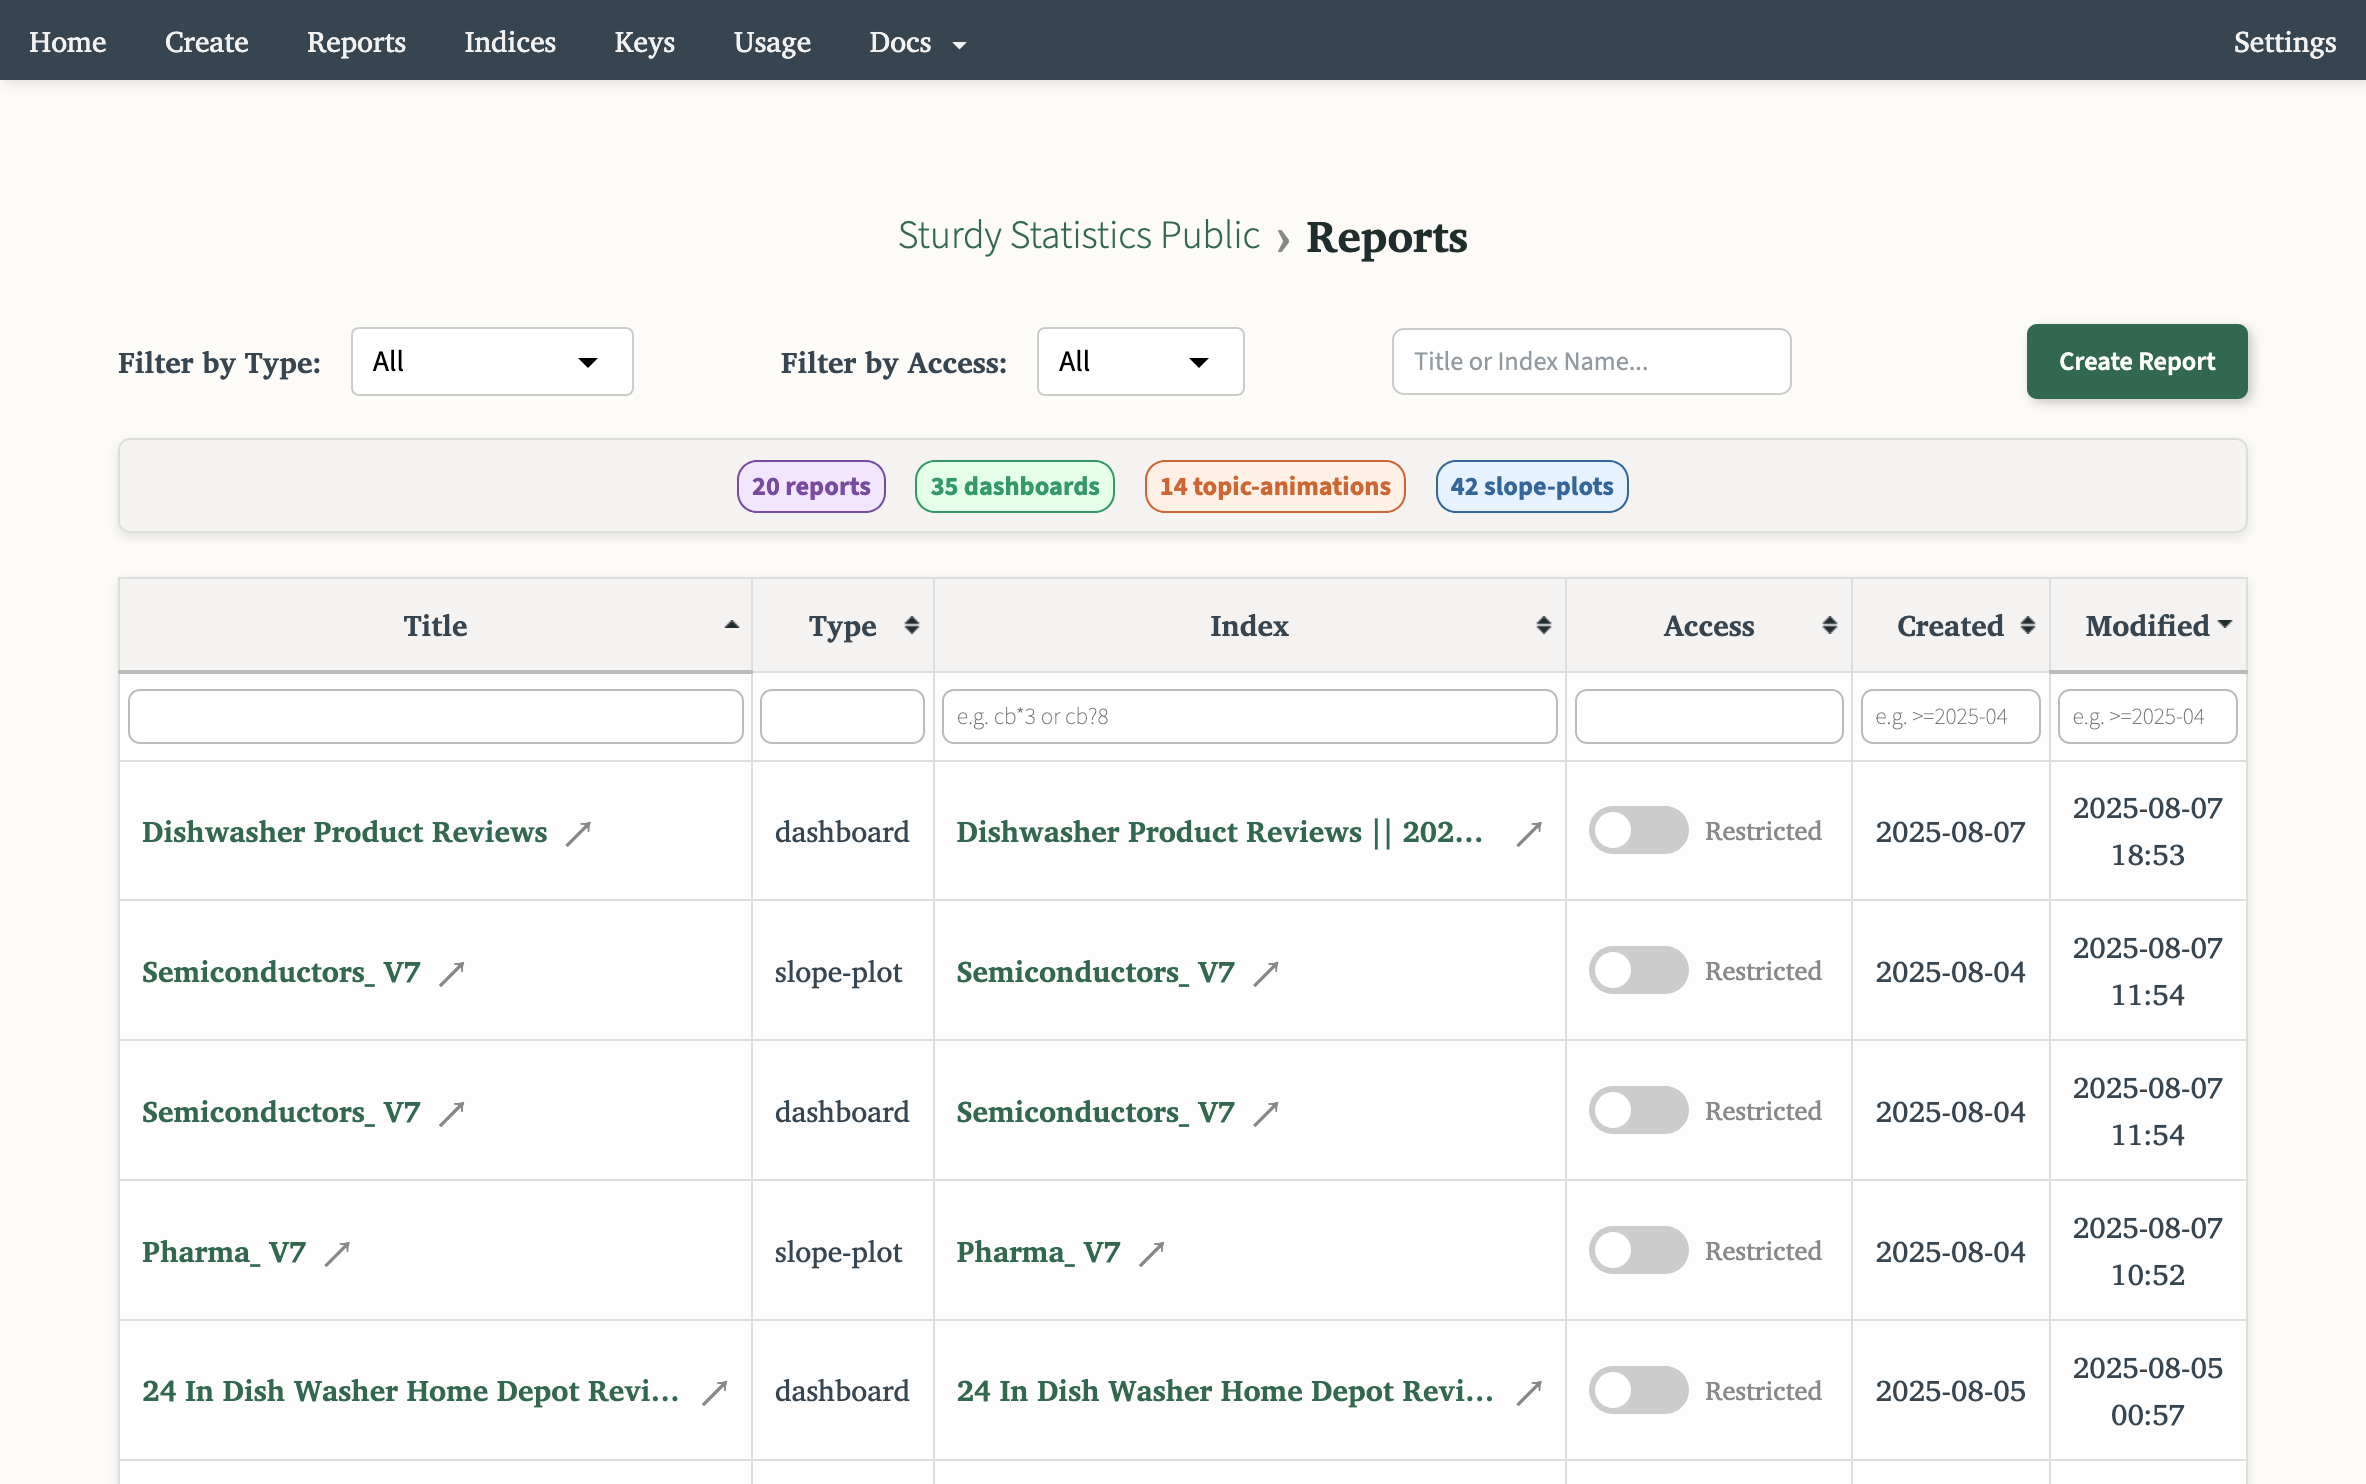
Step 8: Report View
Your report is currently processing and will be listed under In-Progress Reports. Once the report is complete, it will be listed under your Ready Reports. The report will run for about 5 minutes per product included.
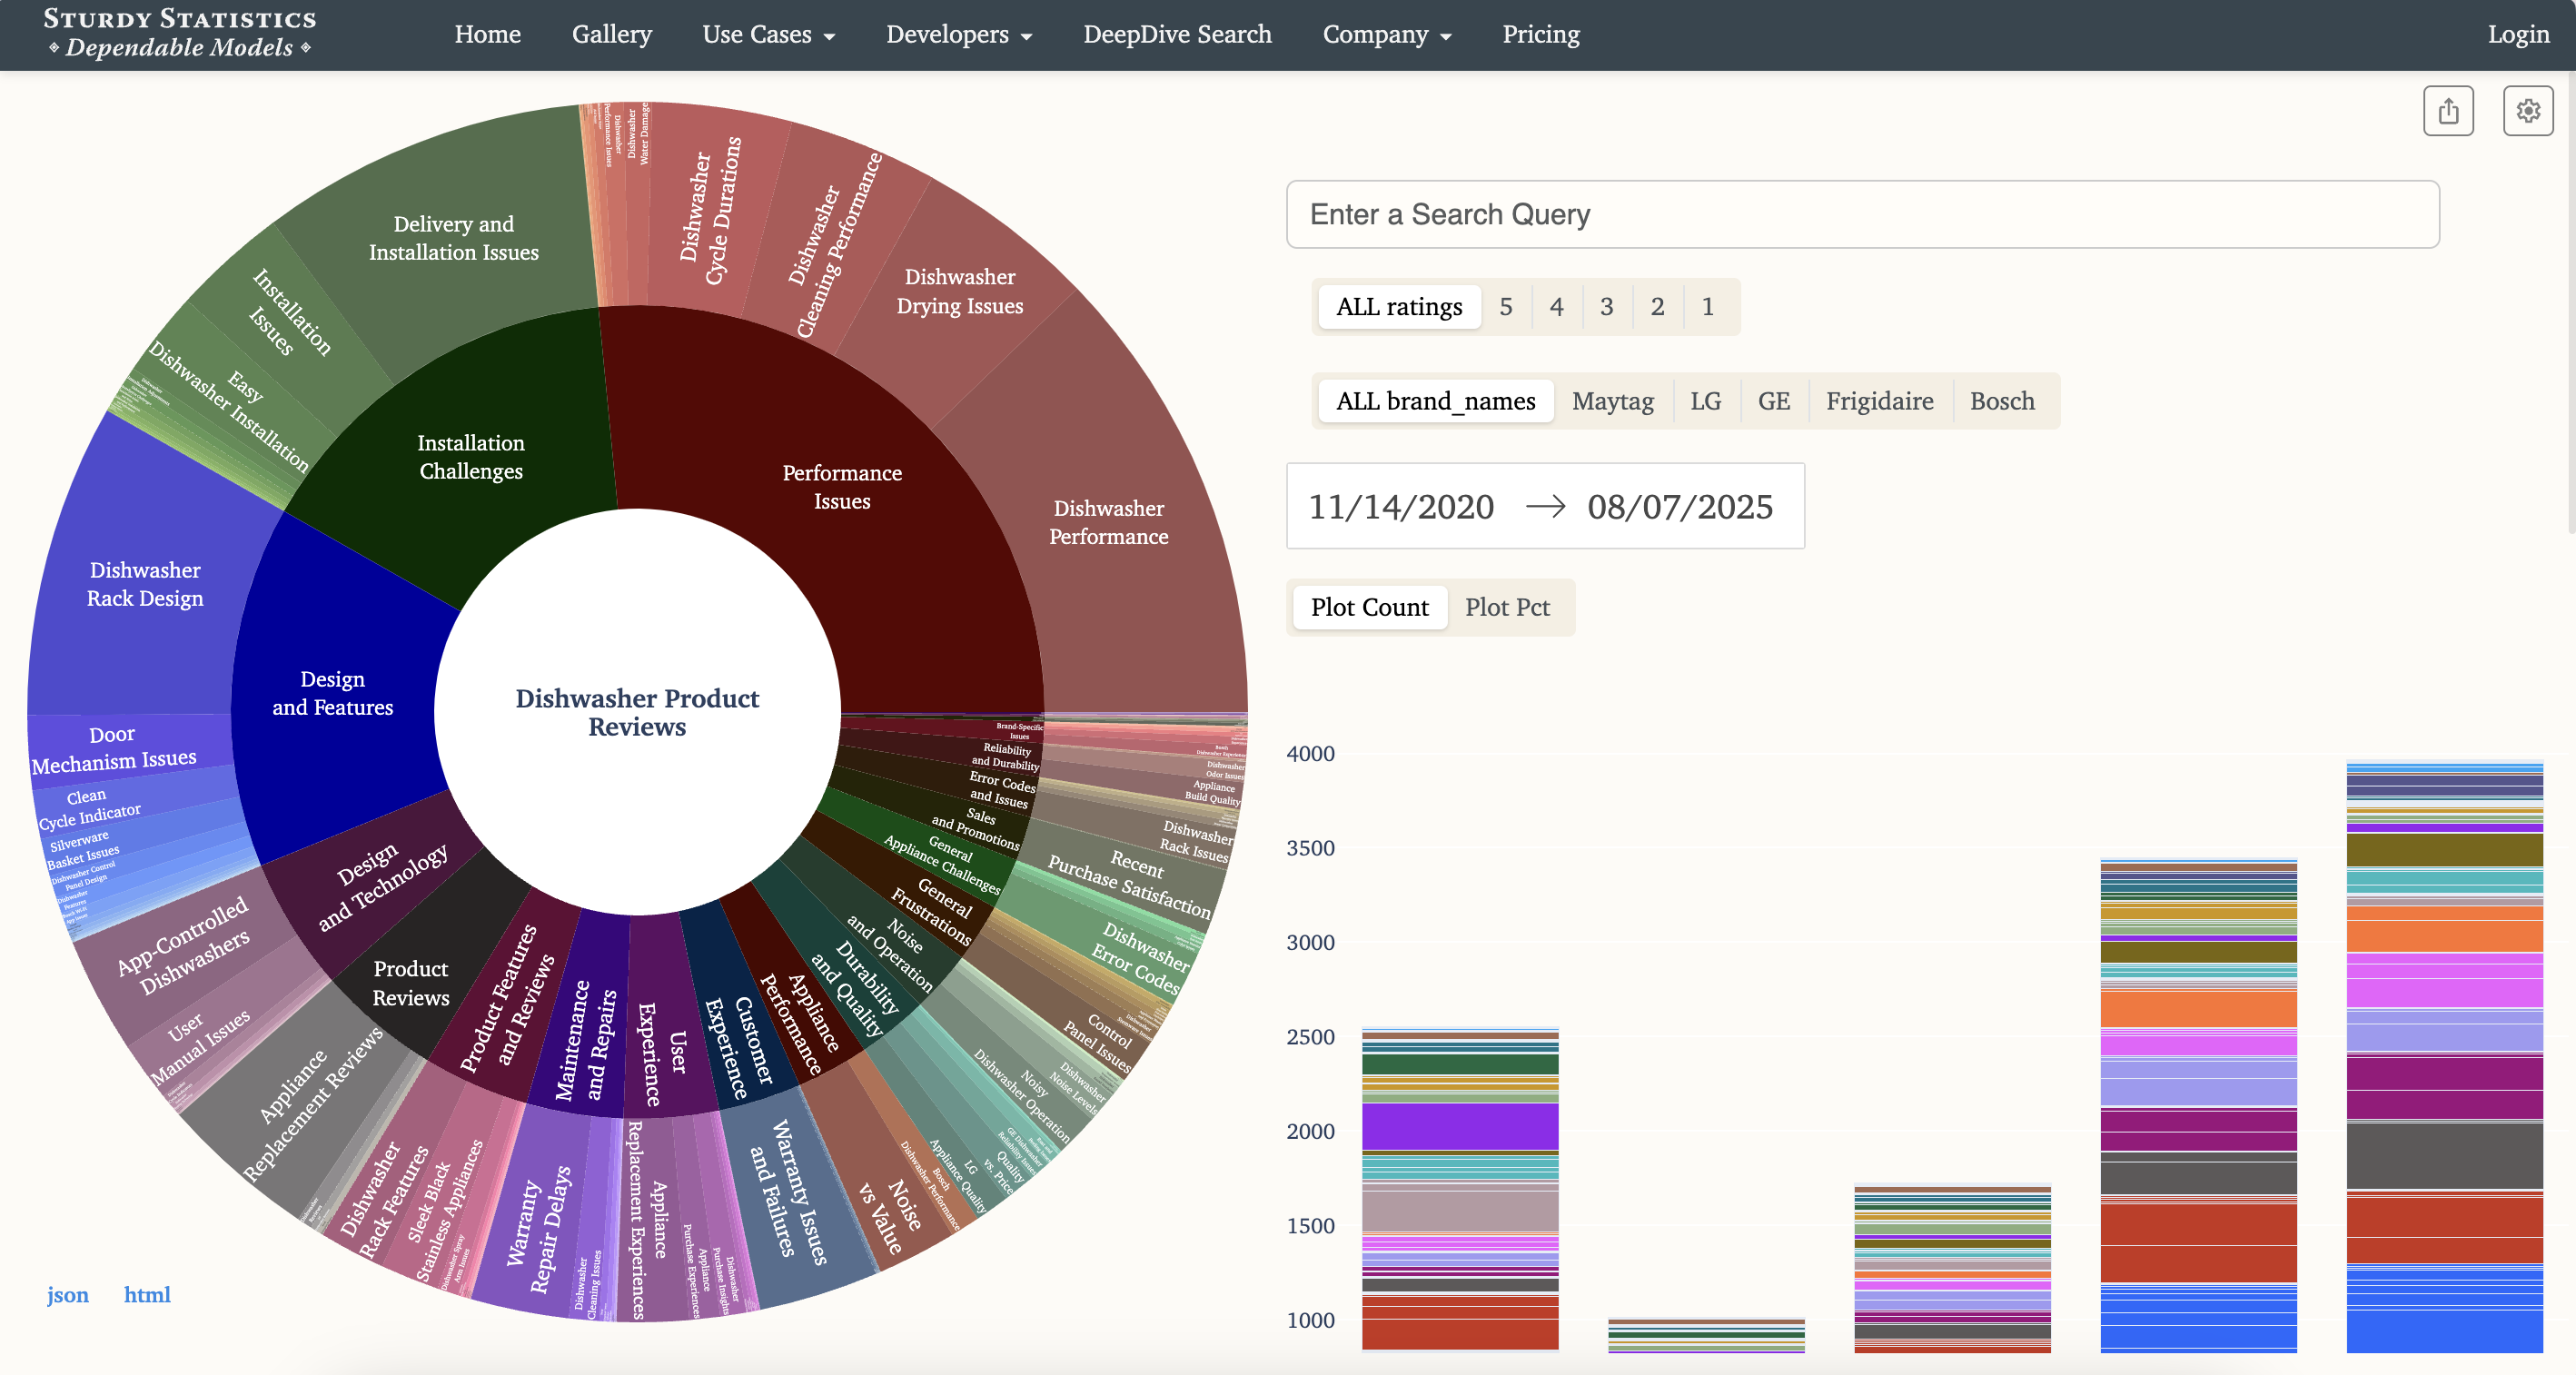
Step 9: View the Dashboard
Click on the Report Title to view the report. It should take you to a dashboard page similar to the one rendered below. You can view the final dashboard here.
NB: Creating Instant Reports
In the Sturdy Statistics platform, when you create a report, you are actually training a statistical model that we call an Index under the hood. Our indices learn the statistical patterns that constructs your data. Extracting these patterns make up the bulk of the report creation time. However, once you have created a report, you can reuse that index to run new analysis and apply your existing reports to new data.
Below, we will walk you through the process of creating an instant report with your newly created index
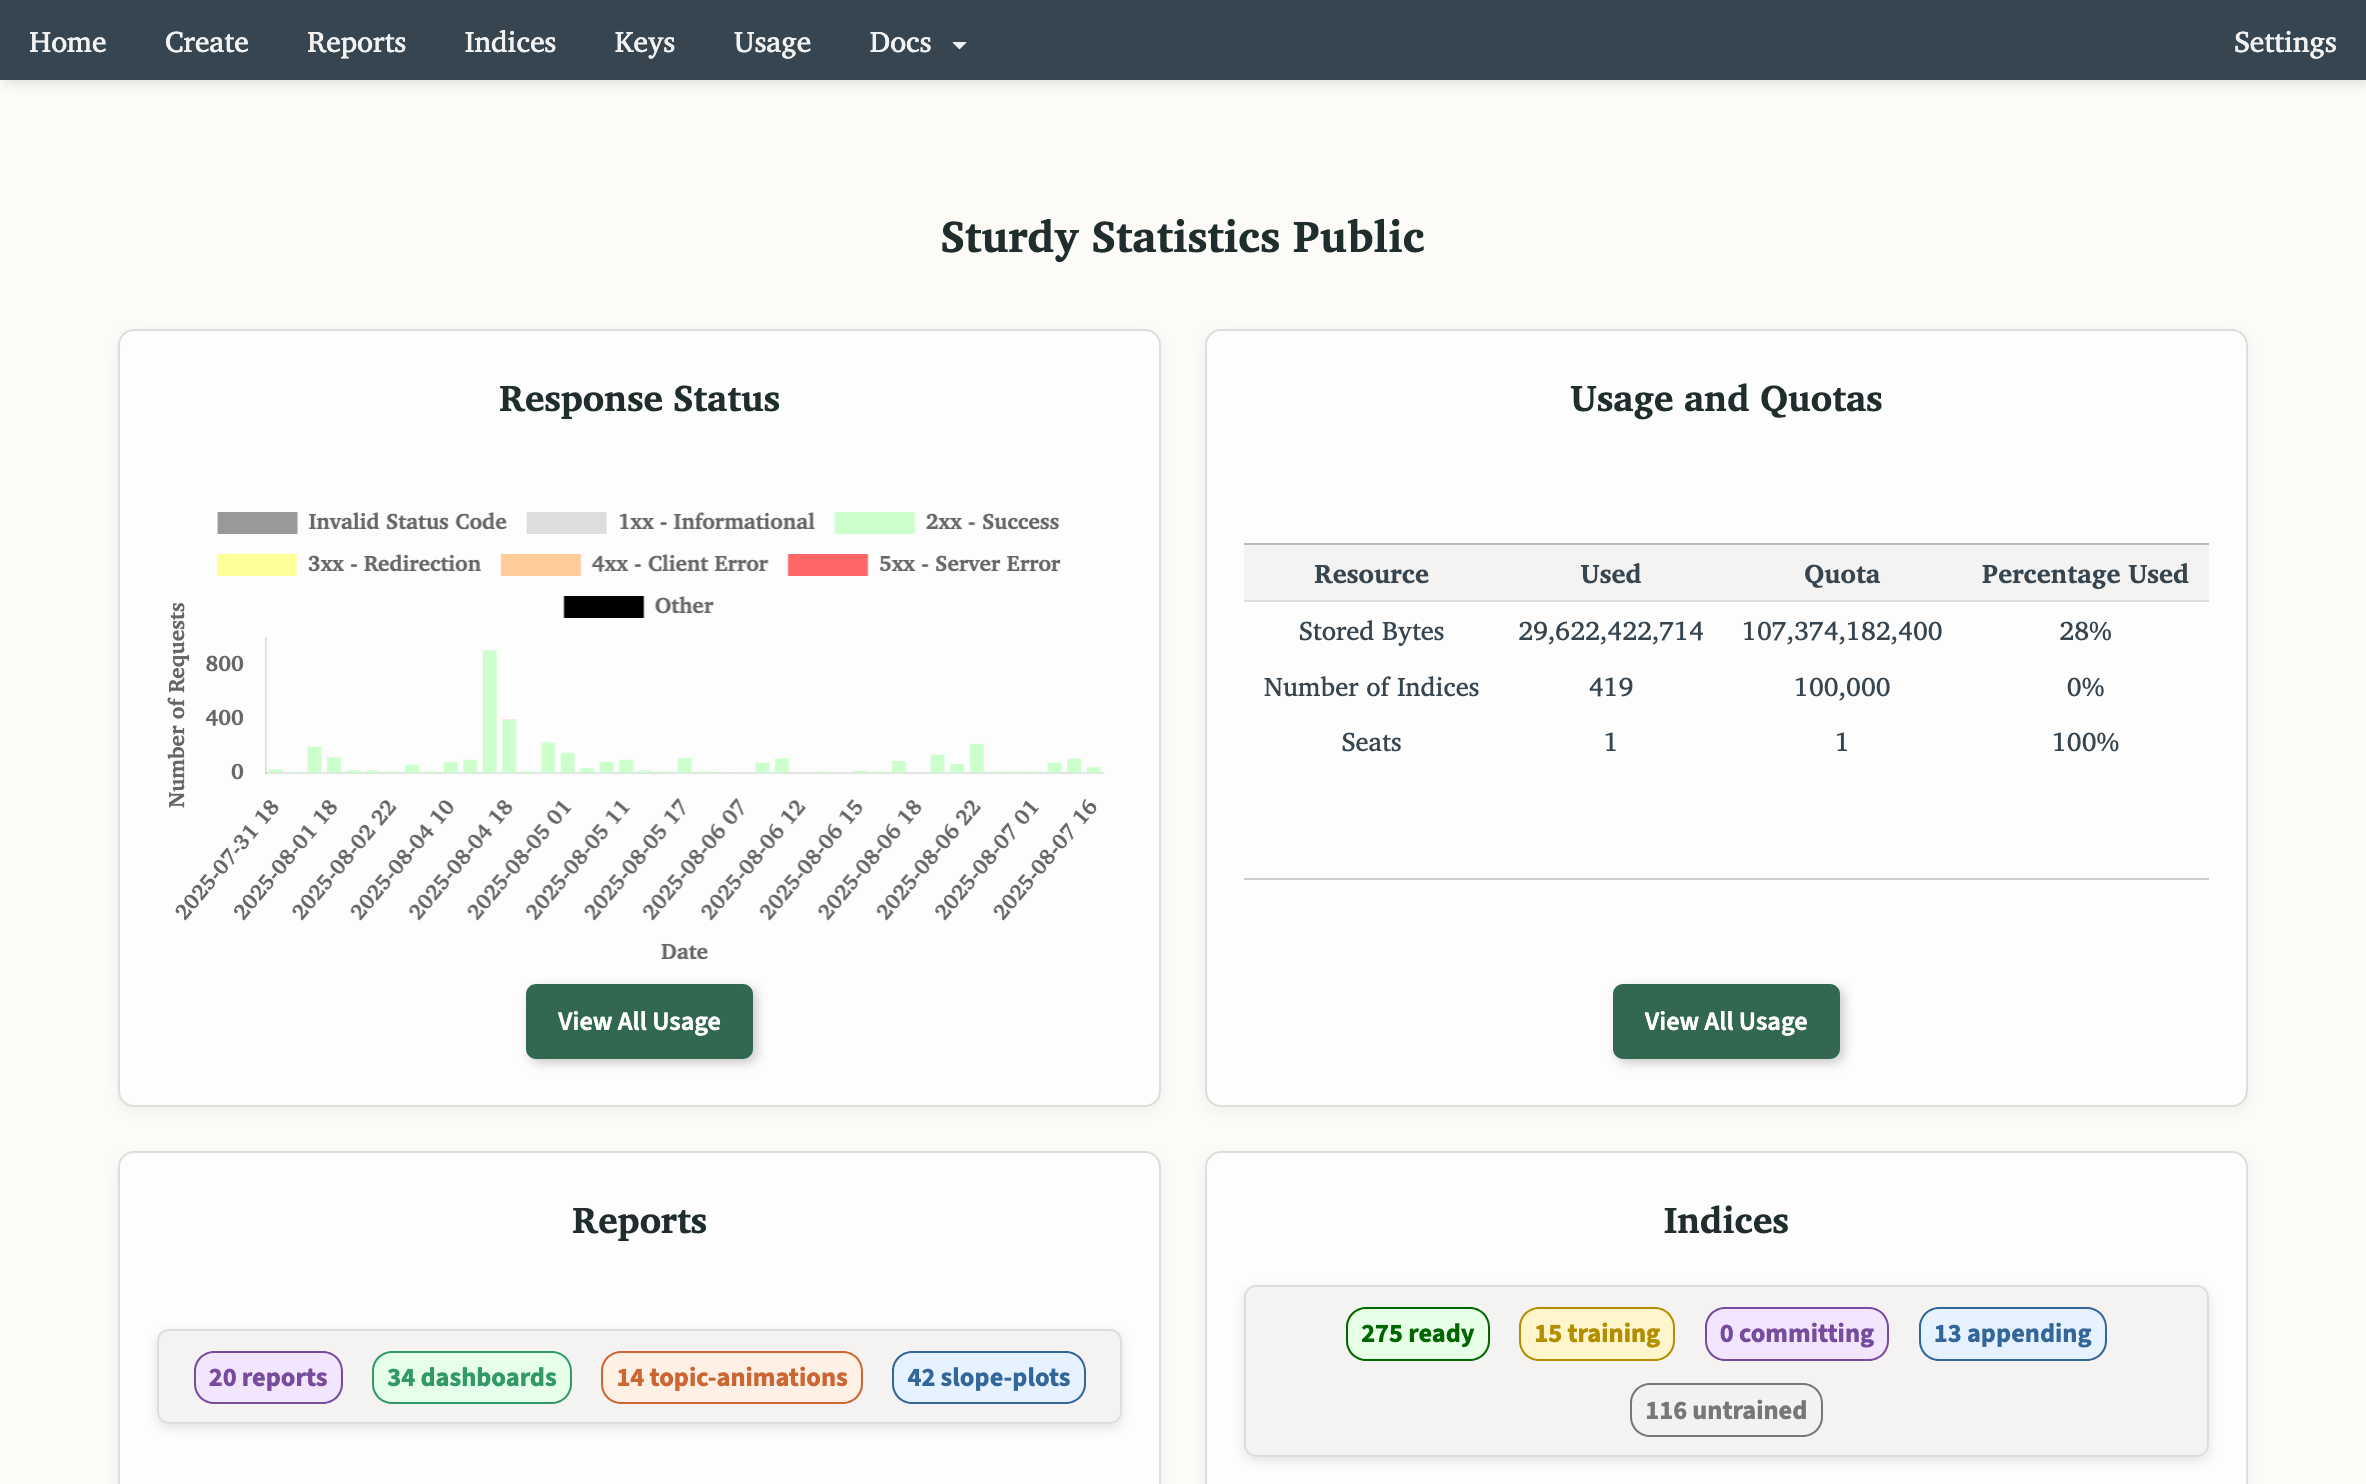
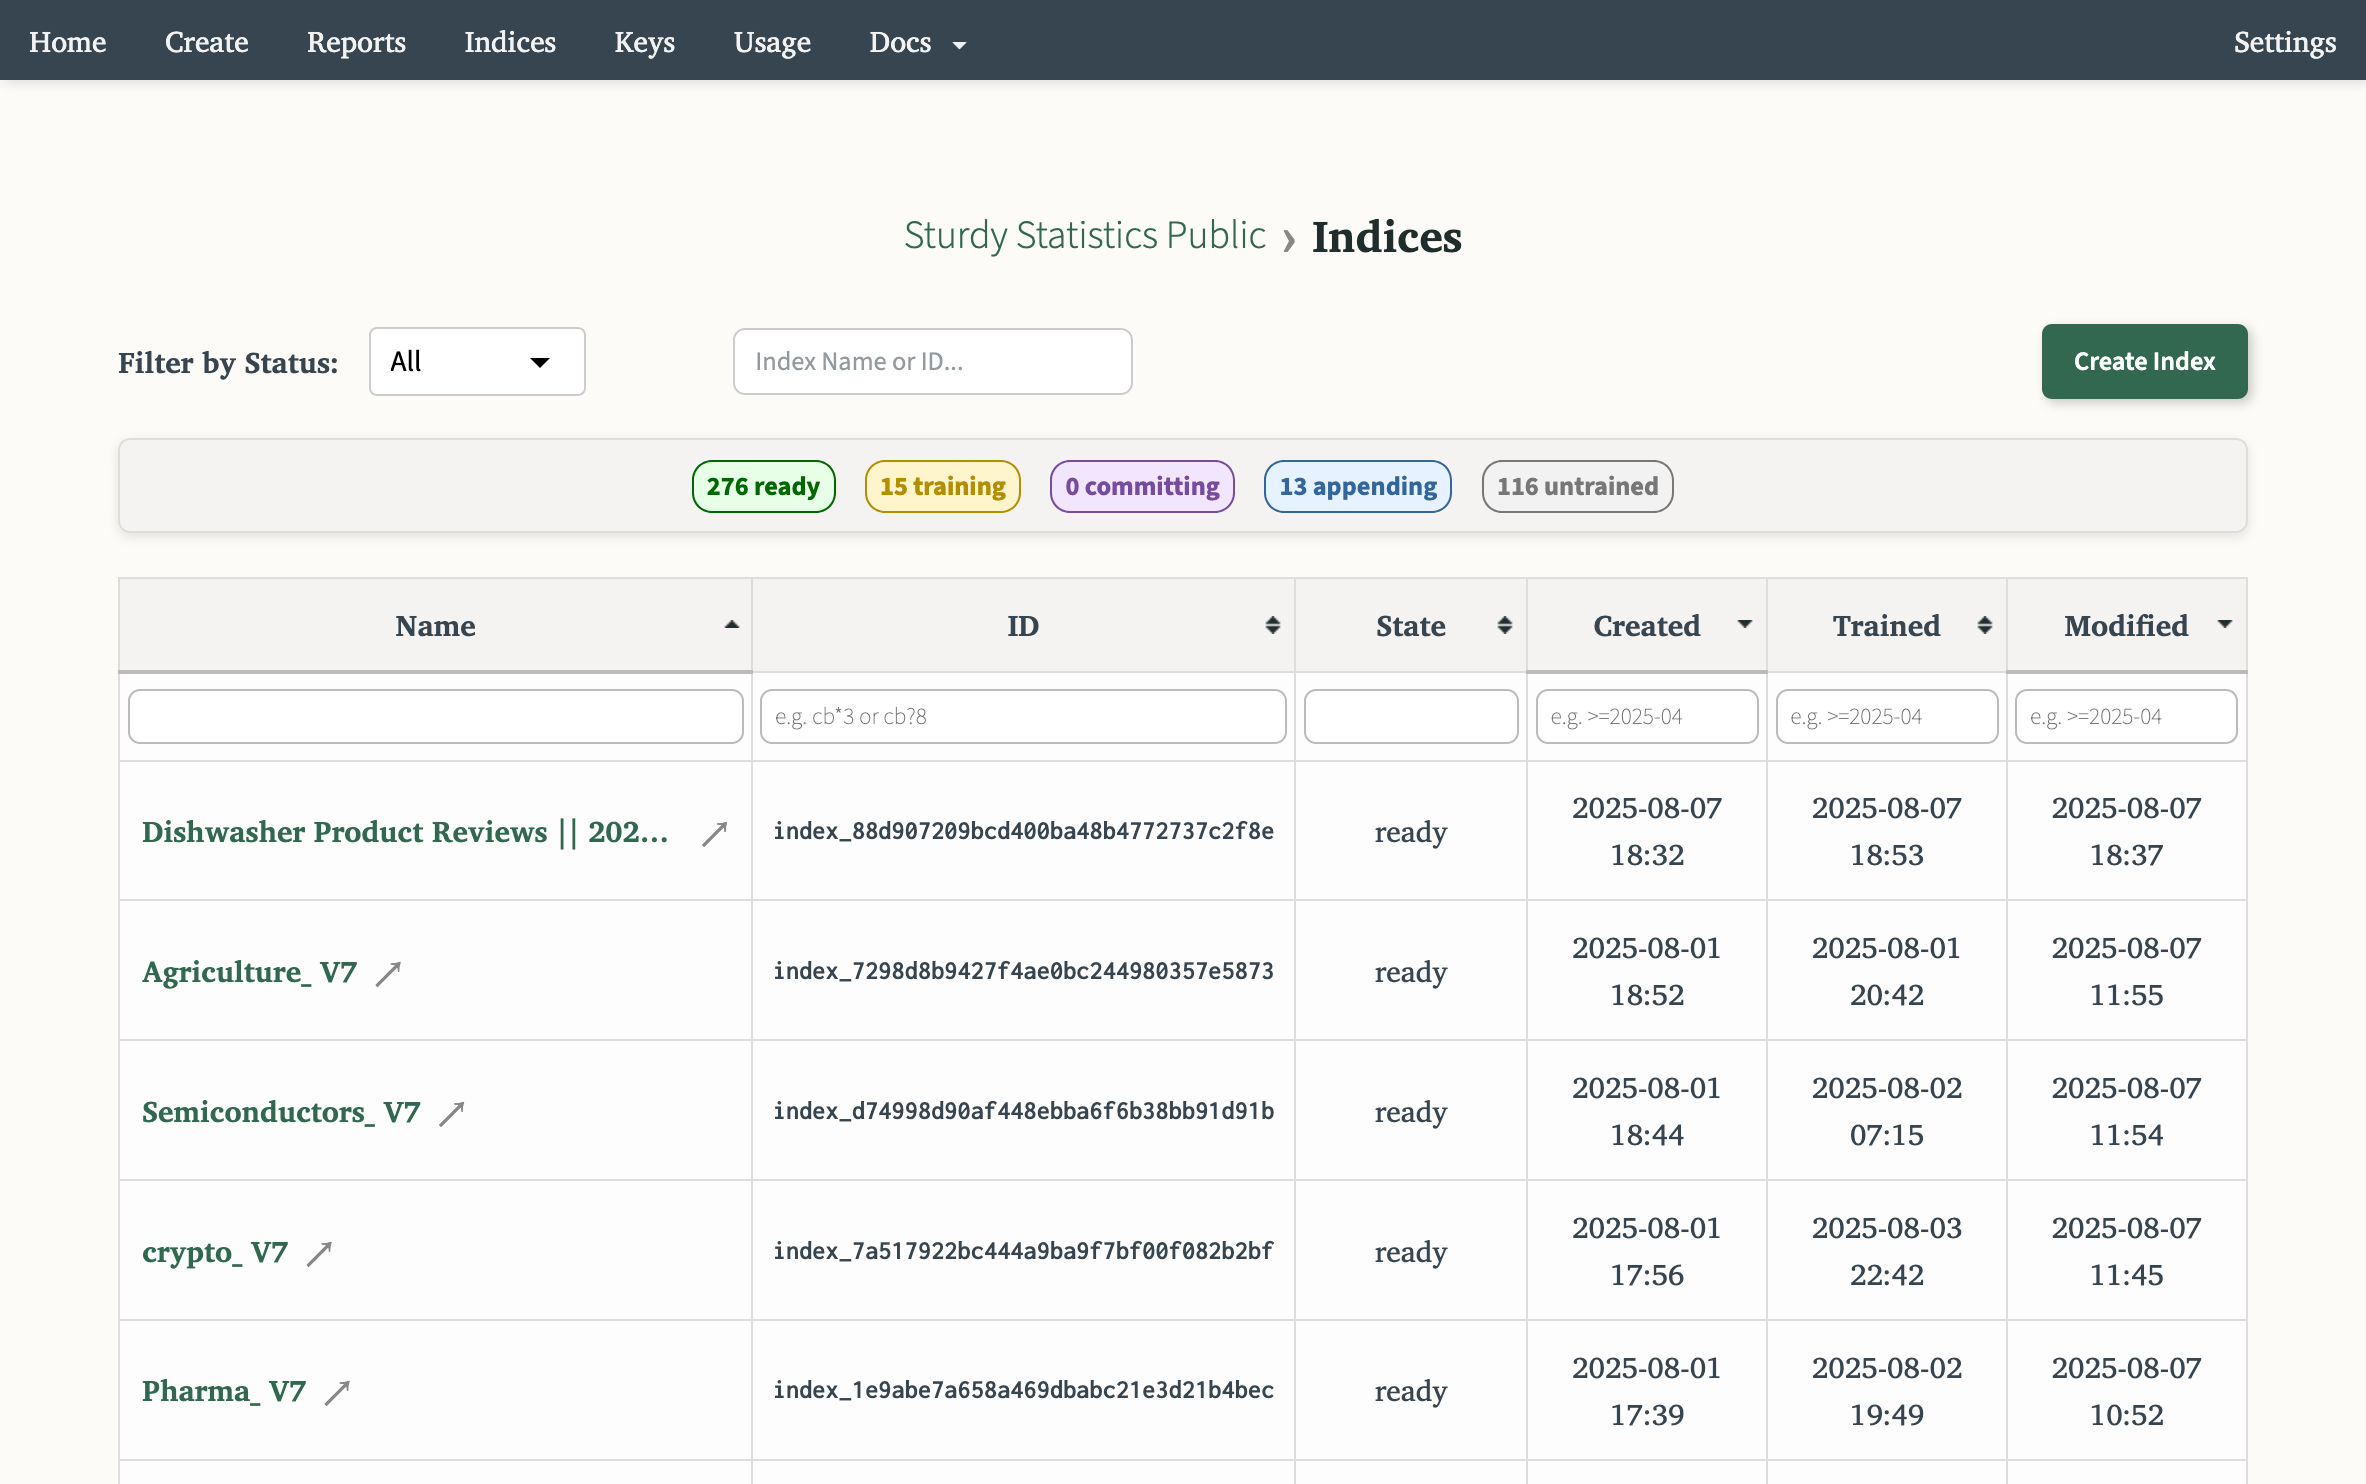
Step 1: View your Indices
Click on the Indices tab in the navbar to go to your Index List page. Click on the name of the index you just created to go to its Index Management page.
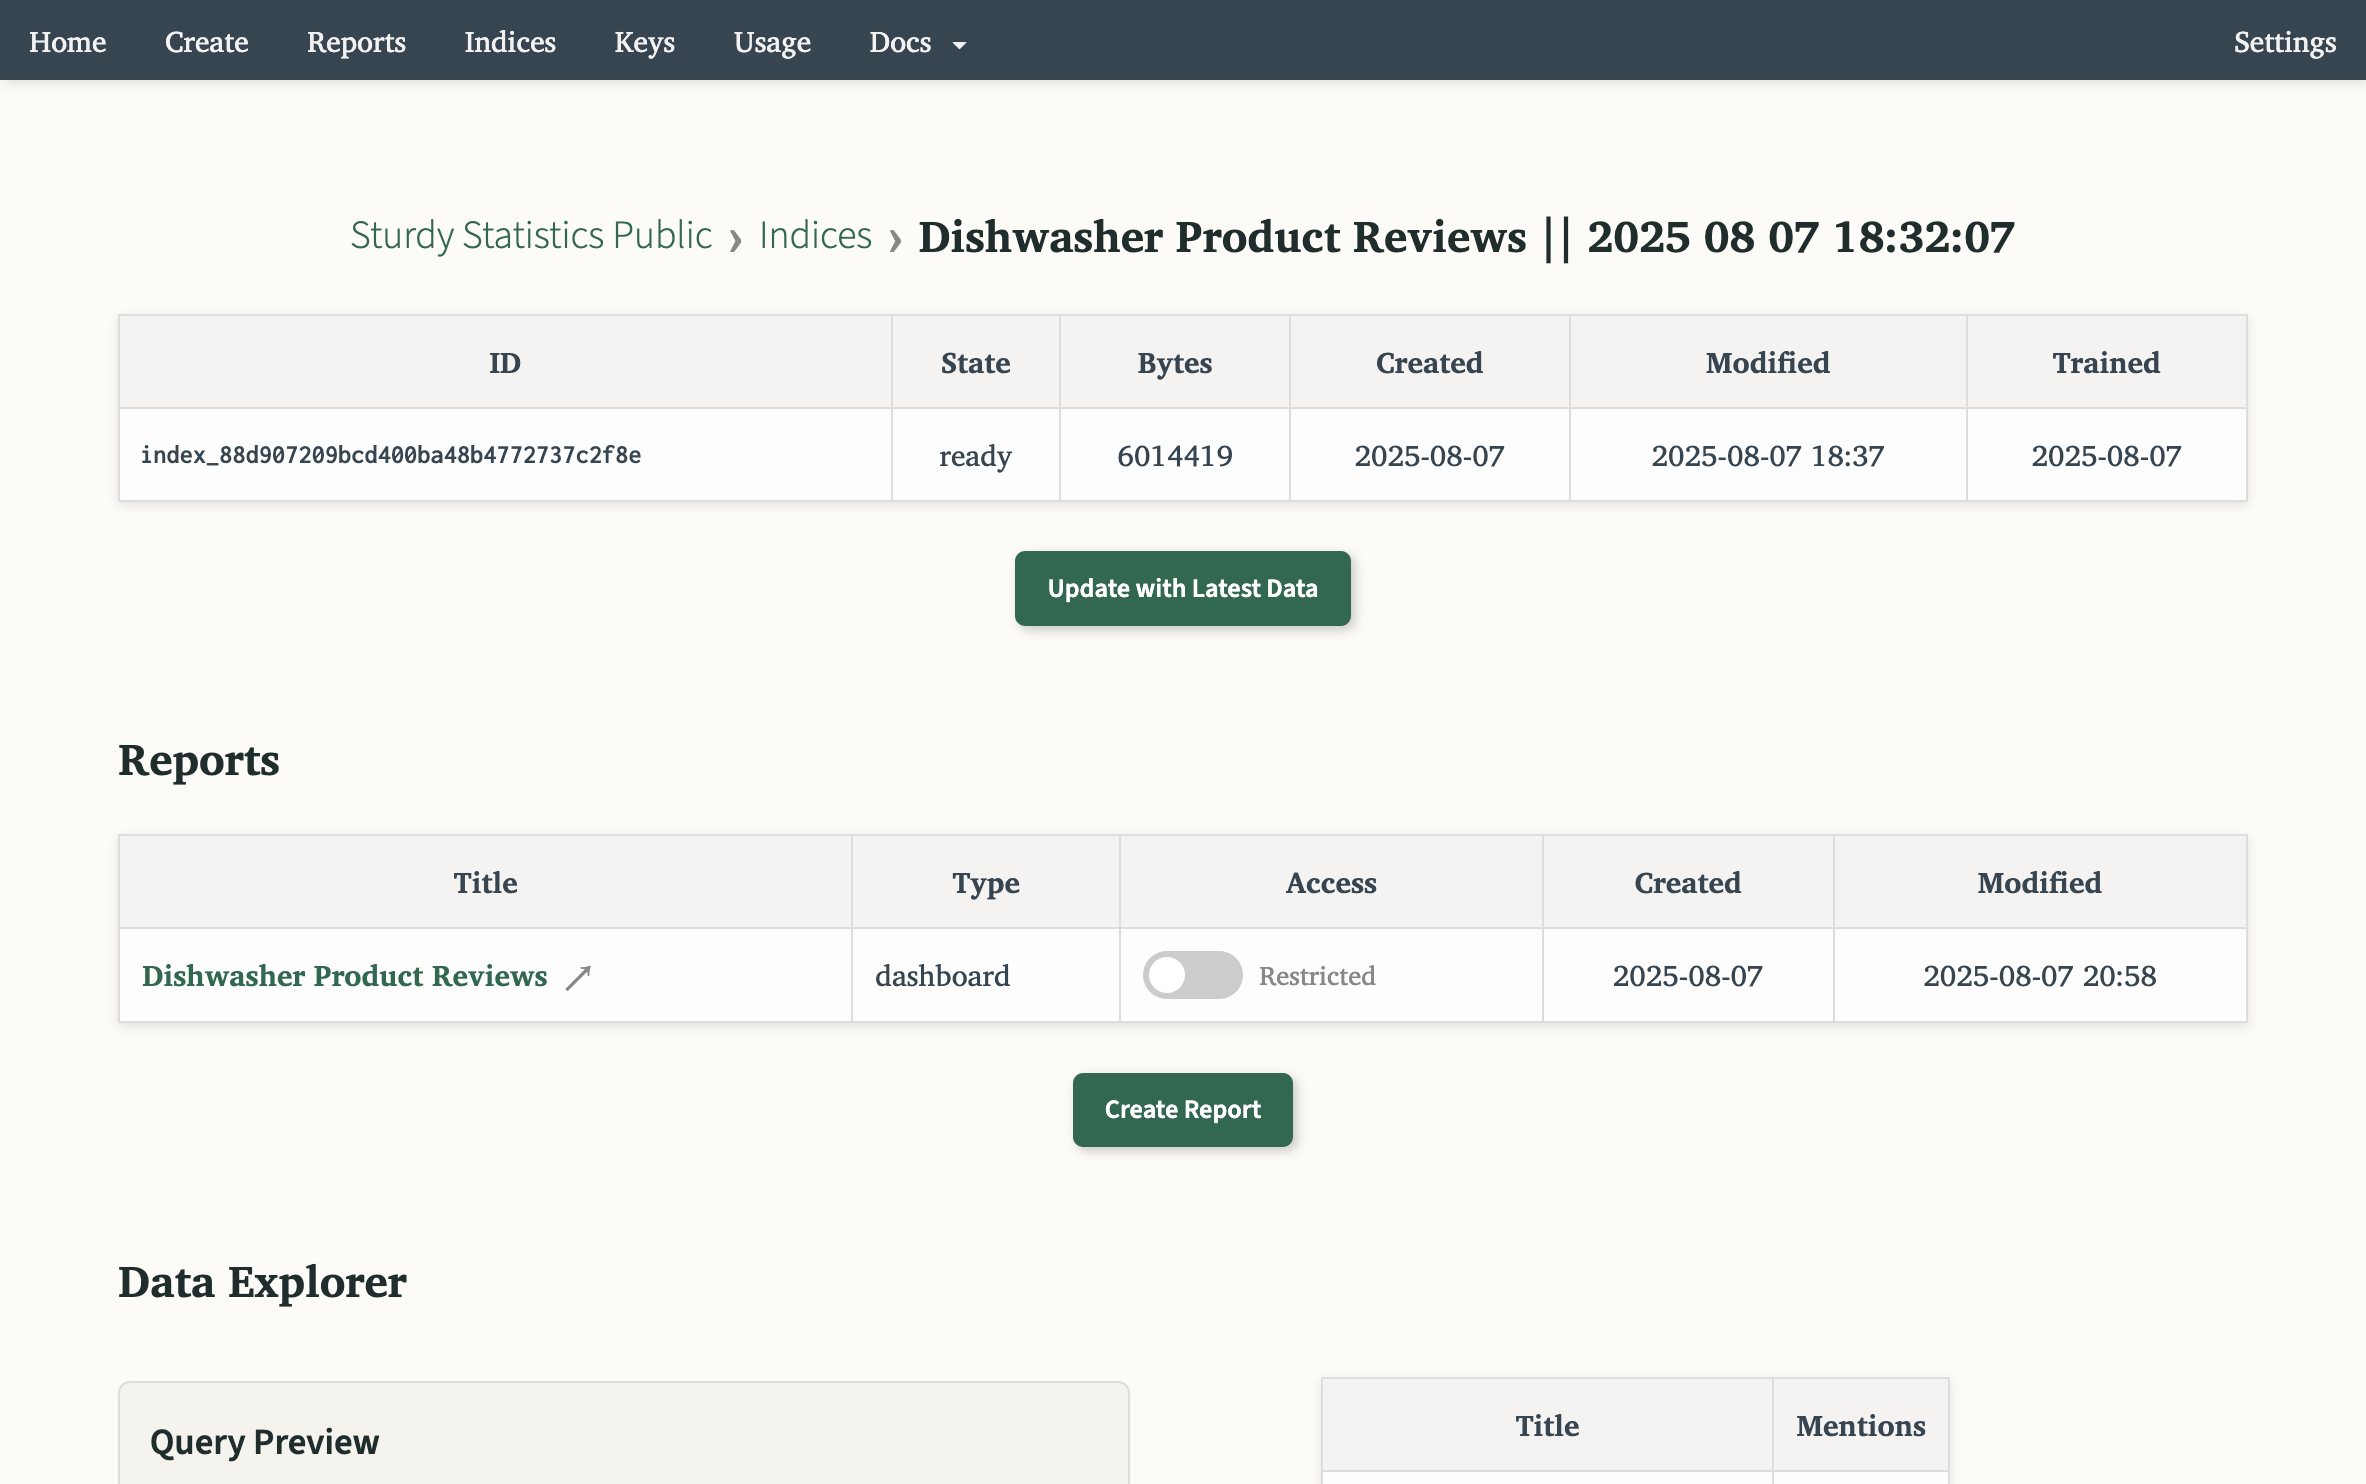
Step 2: Create a Report
This Index management page allows your to create instant reports, update your Index integration datastreams and run SQL queries directly in the platform. Under the Reports table, slick the button Create Report to create an instant report.
Step 3: Select a Report Type
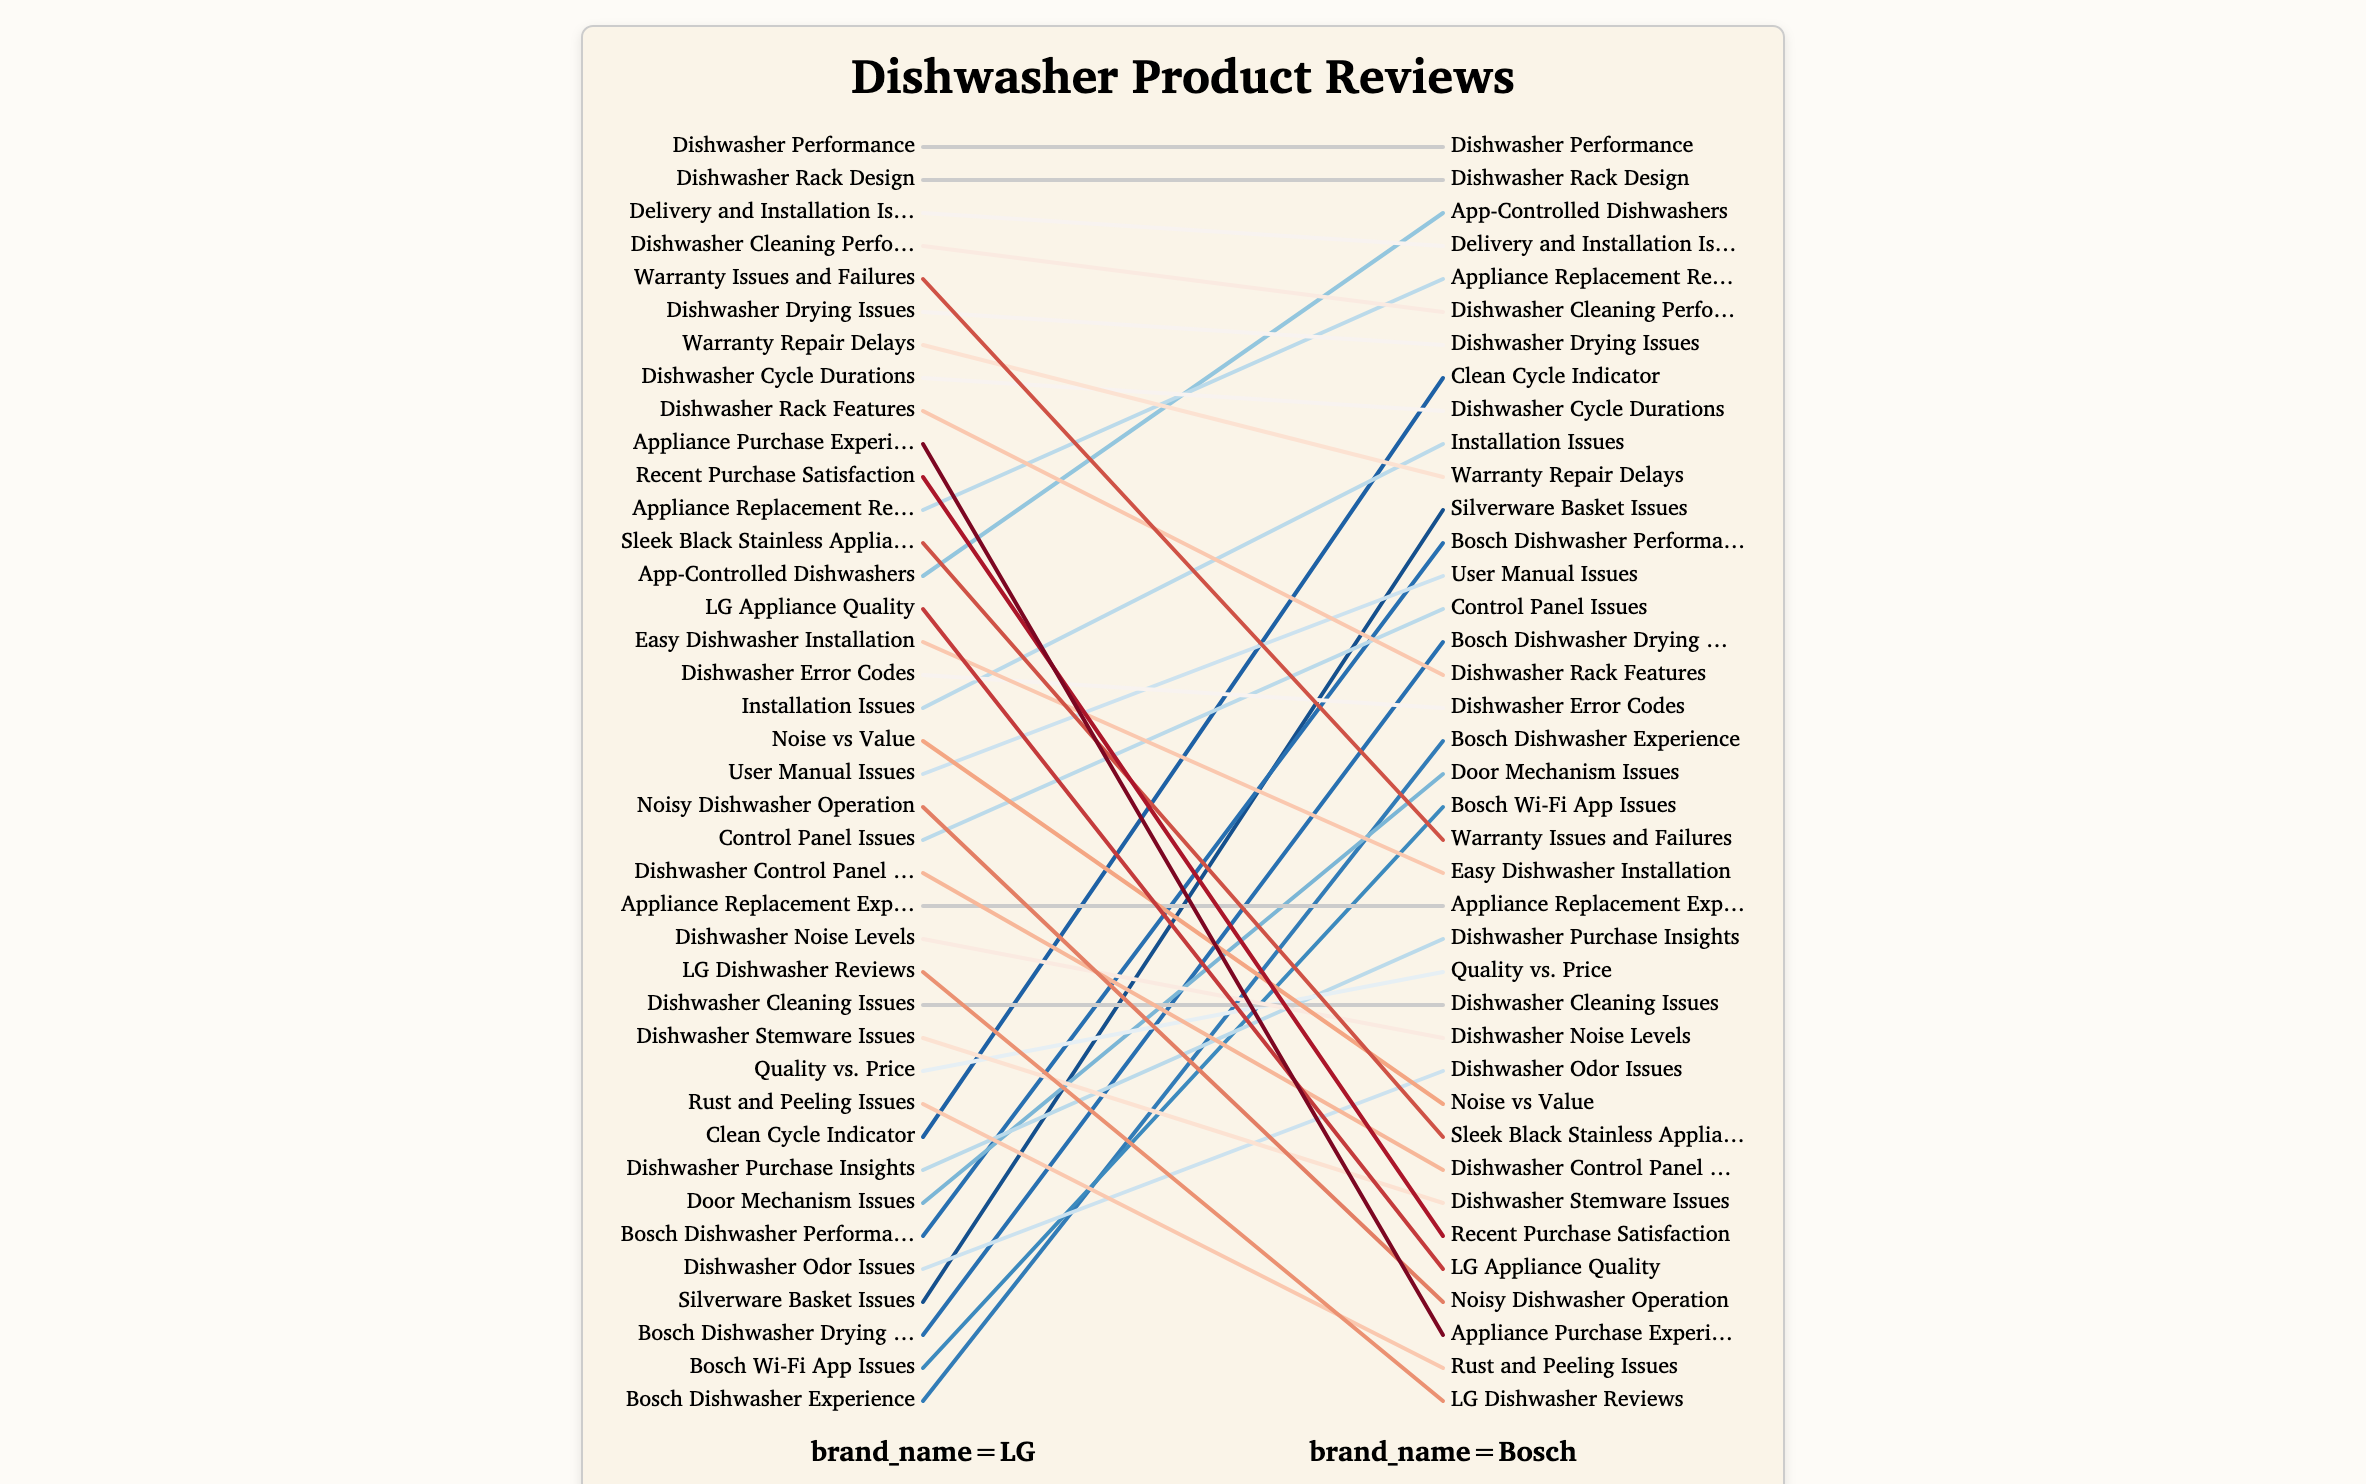
You will be presented with 4 distinct report types. This time, select Trend Comparison.
Step 4: Instant Report
Unlike the initial report kickoff, this report will load instantly. Once an index is trained, you can leverage that to organize your data for dozens of analyses. You can also easily keep your index up to date directly from the Index page or via our API. You can view the final Trend Comparison here.