index = Index(id="index_c6394fde5e0a46d1a40fb6ddd549072e") Found an existing index with id="index_c6394fde5e0a46d1a40fb6ddd549072e".Sturdy Statistics transforms unstructured text into structured, interpretable data— using models that are transparent, verifiable, and robust. You don’t need to write prompts, tune embeddings, or trust a black box. Every insight can be inspected, audited, and traced back to specific passages in your data.
Sturdy Statistics automatic structure enables
All with confidence in how the outputs were generated and with the ability to easily verify every datapoint.
In the following walkthrough, we introduce Sturdy Statistics’ ability to reveal structured insights for unstructured data, not with RAG or LLM black boxes but with rigorous, statistical analysis that leverages traditional tabular data structures. We will analyze the past two years of Earnings Calls from Google, Microsoft, Amazon, NVIDIA, and META.
The indices used in this walkthrough are publicly available with no sign-up or API Key Required. You can expore these indices through our gallery or query them programatically through a globally rate-limitted pool for convenient public access.
To follow along with this walkthrough, simply run:
pip install sturdy-stats-sdk plotlyFor a deeper dive, explore:
To explore your own data (not needed to follow along):
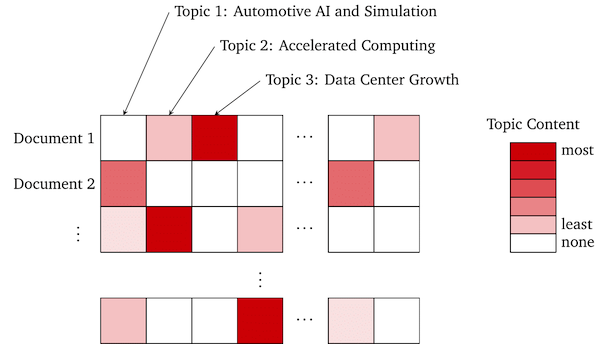
The first API we will explore is the Topic Search API. This API provides a direct interface to the high level themes that our index extracts. You can call with no arguments to get a list of topics ordered by how often they occur in the dataset (prevalence). The resulting data is a structured rollup of all the data in the corpus. It aggregates the topic annotations across each word, paragraph, and document and generates high level semantic statistics.
Mentions refers to the number of paragraphs in which the topic occurs. Prevalence refers to the total percentage of all data that a topic comprises.
Those not using jupyter style notebooks can use plotly offline to display the visualizations:
import plotly.offline as py
py.plot(fig, filename='sunburst.html')So far, we have explored the semantic structure Sturdy Statistics applies to unstructured data via topics and topic groups. In the following sections, we will explore how to leverage this structure to drive both high-level insights and granular analyses.
| Section | Description |
|---|---|
| Part II | Topic-based Granular Retrieval |
| Part III | Semantic Analysis in SQL |
| Part IV | Statistically Tuned Search |
| Part V | Custom Index Creation |