Changes in Novartis’ News Coverage
3 min
pip install sturdy-stats-sdk pandas numpy plotly
from IPython.display import display, Markdown, Latex
import pandas as pd
import numpy as np
import plotly.express as px
from sturdystats import Index, Job

from pprint import pprint## Basic Utilities
px.defaults.template = "simple_white" # Change the template
px.defaults.color_discrete_sequence = px.colors.qualitative.Dark24 # Change color sequence
def procFig(fig, **kwargs):
fig.update_layout(plot_bgcolor= "rgba(0, 0, 0, 0)", paper_bgcolor= "rgba(0, 0, 0, 0)",
margin=dict(l=0,r=0,b=0,t=30,pad=0),
**kwargs
)
fig.layout.xaxis.fixedrange = True
fig.layout.yaxis.fixedrange = True
return fig
def displayText(df, highlight):
def processText(row):
t = "\n".join([ f'1. {r["short_title"]}: {int(r["prevalence"]*100)}%' for r in row["paragraph_topics"][:5] ])
x = row["text"]
res = []
for word in x.split(" "):
for term in highlight:
if term in word.lower() and "**" not in word:
word = "**"+word+"**"
res.append(word)
return f"<em>\n\n#### Result {row.name+1}/{df.index.max()+1}\n\n##### {row['ticker']} {row['pub_quarter']}\n\n"+ t +"\n\n" + " ".join(res) + "</em>"
res = df.apply(processText, axis=1).tolist()
display(Markdown(f"\n\n...\n\n".join(res)))Our bayesian probabilistic model learns a set of high level topics from your corpus. These topics are completely custom to your data, whether your dataset has hundreds of documents or billions. The model then maps this set of learned topics to single every word, sentence, paragraph, document, and group of documents to your dataset, providing a powerful semantic indexing.
This indexing enables us to store data in a granular, structured tabular format. This structured format enables rapid analysis to complex questions.
index = Index(id="index_c6394fde5e0a46d1a40fb6ddd549072e")
# Uncomment the line below to create and train your own index
# index = Index(name="tech_earnings_calls")
if index.get_status()["state"] == "untrained":
index.ingestIntegration("earnings_calls", "GOOG,META,NVDA,AMZN,MSFT")
job = index.train(fast=True, wait=False)
print(job.get_status())
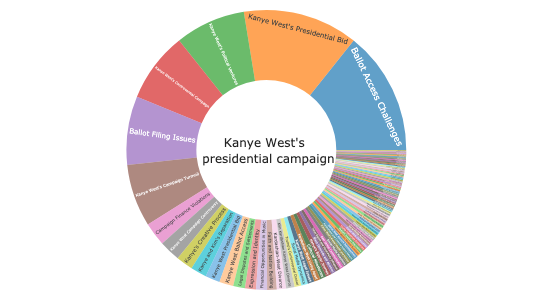
# job.wait() # Sleeps until job finishesFound an existing index with id="index_c6394fde5e0a46d1a40fb6ddd549072e".The inner circle of the sunburst is the title of the plot. The middle layer is the topic groups. And the leaf nodes are the topics that belong to the corresponding topic group. The size of each node is porportional to how often it shows up in the dataset.
index = Index(id="index_c6394fde5e0a46d1a40fb6ddd549072e")
SEARCH_QUERY = "ai infrastructure"
df = index.topicSearch(SEARCH_QUERY, semantic_search_cutoff=.3)
df["title"] = f"{SEARCH_QUERY} <br> In Tech Earnings <br> Calls"
fig = px.sunburst(df, path=["title", "topic_group_short_title", "short_title"], values="prevalence", hover_data=["topic_id"])
procFig(fig, height=500).show()
Found an existing index with id="index_c6394fde5e0a46d1a40fb6ddd549072e".We can select any point above and pull out the actual excerpts that comprise it. Let’s say we are interested diving into the topic AI Model Scaling (topic 53). We can easily query our index to pull out the matching excerpts.
This query is filtering on documents that match on ai infrastructure as well as the topic AI MOdel Scaling (topic 19).`
topic_id = 53
row = df.loc[df.topic_id==topic_id]
row| short_title | topic_id | mentions | prevalence | one_sentence_summary | executive_paragraph_summary | topic_group_id | topic_group_short_title | conc | entropy | title | |
|---|---|---|---|---|---|---|---|---|---|---|---|
| 2 | AI Model Scaling | 53 | 46.0 | 0.04914 | The evolution of AI models focuses on innovati... | The documents discuss the significant advancem... | 6 | AI Innovations | 40.58432 | 5.705012 | ai infrastructure <br> In Tech Earnings <br> C... |
docdf = index.query(SEARCH_QUERY, topic_id=topic_id, semantic_search_cutoff=.3, limit=100, max_excerpts_per_doc=100)
print("Search:", SEARCH_QUERY, "Topic:", row.short_title.iloc[0])
displayText(docdf.iloc[[0, -1]], highlight=[*SEARCH_QUERY.split(), "generative", "model", "data", "center",])

## NB the number of excerpts lines up with the number of mentions
assert len(docdf) == row.mentions.iloc[0]
Search: ai infrastructure Topic: AI Model Scaling
With that, I will walk through the progress we are making across every layer of the tech stack. Azure is the infrastructure layer for AI. We continue to expand our data center capacity in line with both near-term and long-term demand signals. We have more than doubled our overall data center capacity in the last three years and we have added more capacity last year than any other year in our history. Our data centers, networks, racks and silicon are all coming together as a complete system to drive new efficiencies to power both the cloud workloads of today and the next generation AI workloads. We continue to take advantage of Moore’s Law and refresh our fleet as evidenced by our support of the latest from AMD, Intel, NVIDIA as well as our first-party silicon innovation from Maia, Cobalt, Boost and HSM. When it comes to cloud migrations, we continue to see customers like UBS move workloads to Azure. UBS alone migrated mainframe workloads encompassing nearly 400 billion records and 2 petabytes of data. And we remain the cloud of choice for customers’ mission-critical Oracle, SAP and VMware apps. At the data layer, we are seeing Microsoft Fabric breakout. We now have over 19,000 paid customers from Hitachi to Johnson Controls to Schaeffler. Fabric is now the fastest growing analytics product in our history.
…
And the applications could have image in, video out, video in, text out, image in, proteins out, text in, 3D out, video in, in the future, 3D graphics out. So, the input and the output requires a lot of pre and post-processing. The pre and post-processing can’t be ignored. And this is one of the things that most of the specialized chip arguments fall apart and it’s because the length – the model itself is only call it 25% of the data – of the overall processing of inference. The rest of it is about preprocessing and post-processing, security, decoding, all kinds of things like that. And so, I think the multimodality aspect of inference, the multi diversity of inference, that it’s going to be done in the Cloud on-prem. It’s going to be done in multi-cloud, that’s the reason why we have the AI Enterprise in all the clouds. It’s going to be done on-prem, it’s the reason why we have a great partnership with Dell we just announced the other day, called project Helix, that’s going to be integrated into third-party services. That’s the reason why we have a great partnership with ServiceNow, and Adobe, because they’re going to be creating a whole bunch of generative AI capabilities.
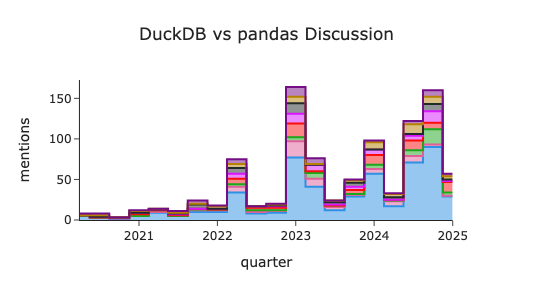
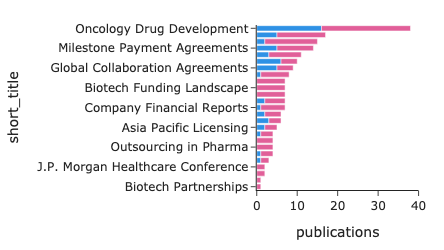
Sturdy Statistics integrates its semantic search directly into its sql api, enabling powerful sql analyses. Let’s quickly explore how much each company is talking about AI infrastructure
SEARCH_QUERY = "ai infrastructure"
df = index.queryMeta("SELECT ticker, pub_quarter, count(*) as mentions FROM paragraph GROUP BY ticker, pub_quarter ORDER BY pub_quarter",
                     search_query=SEARCH_QUERY, semantic_search_cutoff=.1)
fig = px.bar(df, x="pub_quarter", y="mentions", color="ticker", title=f"Mentions of '{SEARCH_QUERY}'")
procFig(fig, title_x=.5).show()Our APIs interoperate extremely easily. Any metadata analysis converted into a topical analysis by passing arbitrary sql filters. This enables us to tie thematic content both semantic, quantitative, and categorical filters, enabling complex rollup analyses of entire corpuses with simple declarative logic.
While it is possible to reconstruct our apis from scratch, the topicSearch is extremely helpful for simple multi-topic analysis. Below we are going to query the topical content of every GOOG quarter that discusses AI Infrastructure with a simple for loop. With this simple logic we can get a complete picture on how Google’s AI strategy has changed over time
dfs = []

## Get all combinations that exist in the data
data = index.queryMeta("SELECT distinct pub_quarter from paragraph WHERE ticker='GOOG'", search_query=SEARCH_QUERY, semantic_search_cutoff=.3)

for quarter in data.pub_quarter:
    tmp = index.topicSearch(SEARCH_QUERY, f"pub_quarter='{quarter}'", semantic_search_cutoff=.1).head(30)
    tmp["quarter"] = quarter
    dfs.append(tmp)
df = pd.concat(dfs)
df["title"] = SEARCH_QUERY + " Mentions"
df = df.loc[df.mentions > 4]
df.sample(5)| short_title | topic_id | mentions | prevalence | one_sentence_summary | executive_paragraph_summary | topic_group_id | topic_group_short_title | conc | entropy | quarter | title | |
|---|---|---|---|---|---|---|---|---|---|---|---|---|
| 23 | Comprehensive Security Solutions | 127 | 5.0 | 0.015947 | Organizations increasingly rely on Microsoft f... | Microsoft has emerged as a leader in cybersecu... | 20 | Investment and Financials | 795.183228 | 6.750616 | 2024Q4 | ai infrastructure Mentions |
| 16 | Consumer Behavior Insights | 139 | 5.0 | 0.020968 | The recurring discussion revolves around under... | The documents highlight a crucial theme center... | 12 | Growth Strategies | 37.742870 | 6.208630 | 2024Q1 | ai infrastructure Mentions |
| 7 | Azure Growth and Optimization | 58 | 6.0 | 0.032984 | The recurring theme emphasizes the importance ... | This theme reflects a comprehensive understand... | 4 | Cloud and Infrastructure | 35.621288 | 6.285496 | 2024Q2 | ai infrastructure Mentions |
| 1 | Capital Expenditure Trends | 171 | 11.0 | 0.059033 | The analysis highlights a significant trend of... | Recent communications from various tech compan... | 8 | Corporate Strategy | 105.942673 | 5.477487 | 2024Q1 | ai infrastructure Mentions |
| 26 | Generative AI Opportunities | 101 | 5.0 | 0.013562 | The discourse highlights the significant growt... | The provided examples articulate a strong cons... | 6 | AI Innovations | 296.260803 | 3.076022 | 2023Q4 | ai infrastructure Mentions |
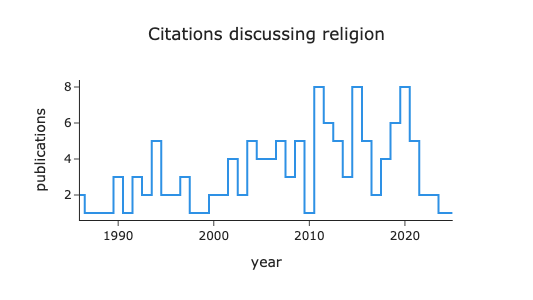
We will plot the topical content of Google’s quarterly discussions in the stacked bar plot below. We can notice the presence of topics such as AI Model Scaling and Accelerated Compute Systems appearing in discussins the past two quarters recently while AI and Device Integrations are no longer a prominent topic of conversation (likley due to lack of success found within mobile AI assistants).
fig = px.bar(
    df.sort_values("quarter"),
    x="quarter",
    y="mentions",
    color="short_title",
    title=f"Earnings Calls Topics: '{SEARCH_QUERY}' GOOG",
    hover_data={"topic_id": True},
)
fig = procFig(fig, height=500)
figWe can support more complex analysis. Above we were limitted to viewing the topics segmented by a single company. Below, we are getting the topics that make up all ticker, quarter combinations in the dataset.
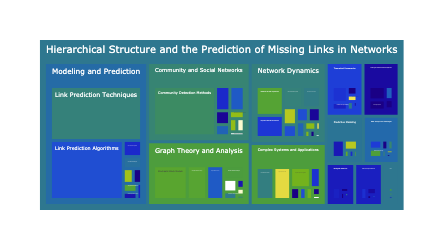
We can leverage a Treemap to present this rich complex data in a nested hierarchical structure. We structure the treemap to group the data first by high level topics, then my company, then by the granular topics that tend to be more company specific. Finally we group them by the quarters that comprise the topics discussions. Click on the plot to explore the levels of structure and hierarchy!
dfs = []

## Get all combinations that exist in the data
data = index.queryMeta("SELECT distinct ticker, pub_quarter from paragraph", search_query=SEARCH_QUERY, semantic_search_cutoff=.1)
for row in data.to_dict("records"):
    ticker, quarter = row["ticker"], row["pub_quarter"]
    tmp = index.topicSearch(SEARCH_QUERY, f"ticker='{ticker}' and pub_quarter='{quarter}'", semantic_search_cutoff=.1).head(30)
    tmp["ticker"] = ticker
    tmp["quarter"] = quarter
    dfs.append(tmp)
df = pd.concat(dfs)


df["title"] = SEARCH_QUERY + " Mentions"
df = df.loc[df.mentions > 0]
fig = px.treemap(df,
                 path=["title",  "topic_group_short_title",  "ticker", "short_title",  "quarter", ],
                 values="mentions",
                 maxdepth=3
)
fig = procFig(fig, height=500)
figfrom sturdystats import Index
index = Index("Custom Analysis")
index.upload(df.to_dict("records"))
index.commit()
index.train()
# Ready to Explore
index.topicSearch()