Changes in Novartis’ News Coverage
3 min
In the following notebook, we will be recreating Sturdy Statistics’ DeepDive page using the sturdy-stats-sdk.
In this notebook we will reproducing this deep dive analysis on every news article that discusses Kanye West.
# pip install sturdy-stats-sdk pandas numpy plotly
from IPython.display import display, Markdown, Latex
import pandas as pd
import numpy as np
import plotly.express as px
from sturdystats import Index, Job

from pprint import pprint## Basic Utilities
px.defaults.template = "simple_white" # Change the template
px.defaults.color_discrete_sequence = px.colors.qualitative.Dark24 # Change color sequence
def procFig(fig, **kwargs):
fig.update_layout(plot_bgcolor= "rgba(0, 0, 0, 0)", paper_bgcolor= "rgba(0, 0, 0, 0)",
margin=dict(l=0,r=0,b=0,t=30,pad=0),
title_x=.5,
**kwargs
)
fig.layout.xaxis.fixedrange = True
fig.layout.yaxis.fixedrange = True
return fig
def displayText(df, highlight):
def processText(row):
t = "\n".join([ f'1. {r["short_title"]}: {int(r["prevalence"]*100)}%' for r in row["paragraph_topics"][:5] ])
x = row["text"]
res = []
for word in x.split(" "):
for term in highlight:
if term in word.lower() and "**" not in word:
word = "**"+word+"**"
res.append(word)
return f"<em>\n\n#### Result {row.name+1}/{df.index.max()+1}\n\n##### {row['published']}\n\n"+ t +"\n\n" + " ".join(res) + "</em>"
res = df.apply(processText, axis=1).tolist()
display(Markdown(f"\n\n...\n\n".join(res)))Sturdy Statistics integrates directly with Hacker News. Below we query the hackernews_comments integration for all comments that mention duckdb.
Training a model on our hacker news integration takes anywhere from 5-10 minutes. This step is optional and you can instead proceed with our public duckdb analysis index.
index = Index(id="index_9e217662c7184573beef6406a1010a19")

# Uncomment the line below to create and train your own index
# index = Index(name="news_kanye_west")

if index.get_status()["state"] == "untrained":
    index.ingestIntegration("news_date_split", "kanye west", )
    job = index.train(dict(subdoc_hierarchy=False), fast=True, wait=False)
    print(job.get_status())
    # job.wait() # Sleeps until job finishes
Found an existing index with id="index_9e217662c7184573beef6406a1010a19".In this section, we will demonstrate how to produce the two core visualization in their simplest form: the sunburst and the time trend plot.
index = Index(id="index_9e217662c7184573beef6406a1010a19")Found an existing index with id="index_9e217662c7184573beef6406a1010a19".Our bayesian probabilistic model learns a set of high level topics from your corpus. These topics are completely custom to your data, whether your dataset has hundreds of documents or billions. The model then maps this set of learned topics to single every word, sentence, paragraph, document, and group of documents to your dataset, providing a powerful semantic indexing.
This indexing enables us to store data in a granular, structured tabular format. This structured format enables rapid analysis to complex questions.
df = index.topicSearch()
df.head(5)[["short_title", "topic_group_short_title", "topic_id", "mentions", "prevalence"]]| short_title | topic_group_short_title | topic_id | mentions | prevalence | |
|---|---|---|---|---|---|
| 0 | Kanye's Creative Process | Creative Works and Collaborations | 463 | 3671.0 | 0.031586 |
| 1 | Expression and Identity | Creative Ventures | 425 | 2943.0 | 0.026436 |
| 2 | Raw Street Communication | Art and Expression | 72 | 2043.0 | 0.019585 |
| 3 | Cultural Influence in Music | Music and Culture | 144 | 1772.0 | 0.018413 |
| 4 | Kanye and Kim's Separation | Celebrity Feuds and Relationships | 291 | 1795.0 | 0.016874 |
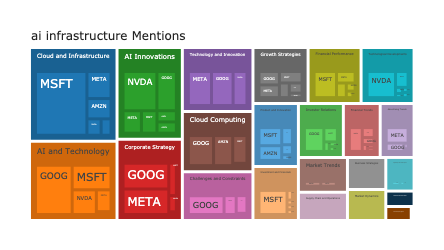
We can see there are two names: short_title and topic_group_short_title. The topic group is a high level thematic category while a topic is a much more granlular annotation.
A dataset can have hundreds of topics, but ussually only 20-50 topic groups. This hierarchy is extremly useful for organizing and exploring data in hierarchical formats such as sunbursts.
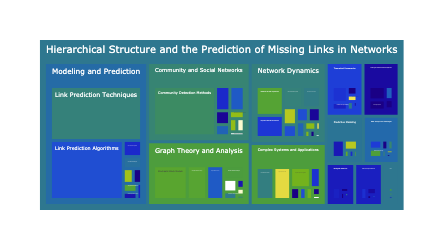
The Inner circle of the sunburst is the title of the plot. The middle layer is the topic groups. And the leaf nodes are the topics that belong to the corresponding topic group. The size of each node is porportional to how often it shows up in the dataset.
df["title"] = "Kanye West <br> News Publications"
fig = px.sunburst(
    df,
    path=["title", "topic_group_short_title", "short_title"],
    values="prevalence", hover_data={"topic_id": True}
)
fig = procFig(fig, height=500)
fig.show()SEARCH_QUERY = "presidential campaign"When you submit a search query, our indexing model maps your query to its thematic contents. Our index is a unified Bayesian probabilistic model and we use a statistically meaningful scoring metric called hellinger distance to score each candidate excerpt within your Index. Unlike cosine distance whose values are not well defined and can be used only to rank, the hellinger distance score defines the percentage of a document that ties directly to your theme.
This well defined score enables not only search ranking, but semantic search filter as well with the ability to define a hand-selected hard cutoff.
docdf = index.query(SEARCH_QUERY, semantic_search_cutoff=.2, limit=100, context=1)
displayText(docdf.iloc[[0, -1]], highlight=[*SEARCH_QUERY.split(" ")])
Kanye West Hired a 180-Person Presidential Campaign Staff and Now They’ve Been Told “He’s Out”: Report It’s no secret Kanye West has been gunning to become President of the Unites States since announcing his bid for the 2020 presidential election in 2015. However, it looks like the rapper’s dreams of taking over the White House may be coming to an end.
…
“Omg that is absolutely atrocious. I’m appalled. Even if it is a joke she has MILLIONSSS of followers,” tweeted lifestyle and beauty YouTube star Nicol Concilio, adding in a follow-up tweet, “Also has she even said a damn thing about the election at all?? I really can’t believe this s—t.” KANYE WEST’S CAMPAIGN HAS SPENT NEARLY $6M ON PRESIDENTIAL RUN, DOCUMENTS SHOW West first announced he was running for president on July 4, and his wife, Kim Kardashian West, 39, retweeted that post with an added American flag emoji.
You will notice that accompanying each excerpt is a set of tags. These tags are the exacts some topics that we visualized in the sunburst. The topicSearch (and all other topic apis) are simple rollups over segments of data you defined.
The Sturdy Statistics API offers a unified interface for query thematic content as well. This leverages our vertically integrated thematic search. The search query you provide here matches on the exact same set of documents as the query above, but instead of providing the data, it provides a rollup on the thematic content of the data.
topic_df = index.topicSearch(SEARCH_QUERY)
topic_df["title"] = f"Kanye West's <br> {SEARCH_QUERY}"
fig = px.sunburst(topic_df, path=["title",  "short_title"], values="prevalence", hover_data={"topic_id": True})
fig = procFig(fig, height=500)
fig.show()We can select any point above and pull out the actual excerpts that comprise it. Let’s say we are interested diving into the topic Ballot Filing Issues (topic 417). We can easily query our index to pull out the matching excerpts.
This query is filtering on documents that match on pandas as well as the topic Ballot Filing Issues.
topic_id = 417
row = topic_df.loc[topic_df.topic_id==topic_id]
row| short_title | topic_id | mentions | prevalence | one_sentence_summary | executive_paragraph_summary | topic_group_id | topic_group_short_title | conc | entropy | title | |
|---|---|---|---|---|---|---|---|---|---|---|---|
| 4 | Ballot Filing Issues | 417 | 305.0 | 0.074046 | The articles discuss various challenges faced ... | The theme highlights the significant hurdles e... | 31 | Legal and Financial Matters | 387.465729 | 5.21887 | Kanye West's <br> presidential campaign |
docdf = index.query(SEARCH_QUERY, topic_id=topic_id, semantic_search_cutoff=.2, context=1)
print("Search:", SEARCH_QUERY, "Topic:", row.short_title.iloc[0])
displayText(docdf.iloc[[0, -1]], highlight=[*SEARCH_QUERY.split(" "), "ballot", "late", "nomination", "clock"])
Search: presidential campaign Topic: Ballot Filing Issues
Kanye West’s presidential campaign claimed that the rapper’s faulty iPhone clock should be blamed after West’s ballot was filed 14 seconds after the deadline. According to 9TO5Mac’s latest report, a drawback was faced by Kanye West after his presidential ballot was registered in Wisconsin about 14 seconds late. Also Read : Get to Know DrDisRespect and Why His YouTube Debut Hyped the Gaming Community Following Controversial Twitch Ban
…
Also Read : Get to Know DrDisRespect and Why His YouTube Debut Hyped the Gaming Community Following Controversial Twitch Ban His lawyer explained various reasons why it happened, including suggesting that the celebrity’s iPhone clock is “notoriously faulty.” The Milwaukee Journal Sentinel’s latest report stated that a state Elections Commission staffer admitted to one of West’s campaign aides that she submitted the candidate’s nomination papers a few seconds after the deadline, as stated in the 23-page document filed on Monday, Aug. 10. However, the papers should be filed by “not later” than 5 p.m., the State law says.
Sturdy Statistics embeds all of its semantic information into a tabular format. It directly exposes this tabular format through the queryMeta api.
In fact, all of our topic apis directly query the same tabular data structures that we expose in the queryMeta api.
Similar to our topic api, Sturdy Statistics integrates its semantic search directly into its sql api, enabling powerful sql analyses. For this analysis we will also change up our search query to explore new content.
df = index.queryMeta("""
SELECT
date_trunc('month', published::DATE) as month,
count(*) as comments
FROM doc
GROUP BY month
ORDER BY month
""",
SEARCH_QUERY)
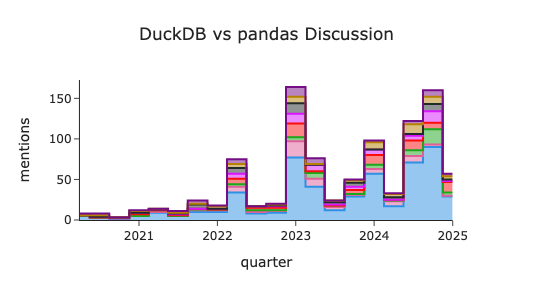
fig = px.line(df,
"month", "comments",
line_shape="hvh",
title=f"Kanye West News::{SEARCH_QUERY} over Time"
)
procFig(fig)Just as we were able to focus in on a specifc topic in our query, we can also query topics directly within sql.
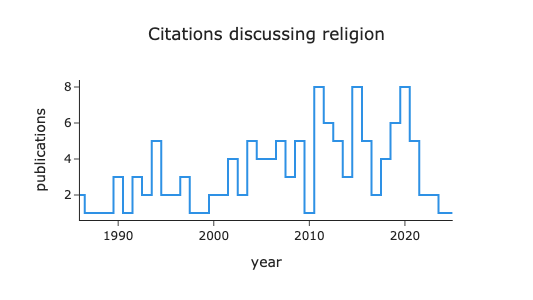
Below, we query the number of paragraphs that mention the topic Ballot Filing Issues (topic 417).
topic_id = 417
df = index.queryMeta(f"""
SELECT
    date_trunc('month', published::DATE) as month,
    sum((sparse_list_extract(
        {topic_id+1}, -- 1 indexed
        c_mean_avg_inds,
        c_mean_avg_vals
    ) > 2.0)::INT) as comments
FROM paragraph
GROUP BY month
ORDER BY month
""",
search_query=SEARCH_QUERY, semantic_search_cutoff=.2)
fig = px.line(df, "month", "comments", line_shape="hvh", title=f"Kanye West News::Ballot Filing Issues")
procFig(fig).show()Every high level visualization or rollup can be instantly tied back to the original data, no matter how granular or complex.
Let’s saw we want to pull out all hacker news comments that discuss pandas and mention the topic Complex SQL Queries that happened in 2025. That is a simple API call
docdf = index.query(SEARCH_QUERY, topic_id=topic_id, semantic_search_cutoff=.2, limit=100, filters="year(published::DATE) = 2021")
print("Search:", SEARCH_QUERY, "Topic:", row.short_title.iloc[0])
displayText(docdf.iloc[[0, -1]], highlight=["duckdb", SEARCH_QUERY, "faster", "complex", "sql", "aggregate", "relational", "api"])
Search: presidential campaign Topic: Ballot Filing Issues
Thanks to the high-level Republicans apparently steering West’s presidential campaign, the intended effect, whether the rapper knew it or not, may have been to serve as a spoiler to drain votes from Democratic nominee Joe Biden to then-President Donald Trump. In 2020 West sued the state of Wisconsin to appear on the 2020 ballot using a Trump-linked law firm – the elections commission later voted to keep him off.
…
Colorado-based attorney Mario Nicolais, who had scrutinized the West campaign’s ballot petition activity in Wisconsin last August, told The Daily Beast that the GOP’s targeting West—who, according to his then-wife Kim Kardashian, had been contending with mental health struggles—was “about as bottom-of-the-barrel moral turpitude as you can be, in my opinion. Just sleazy, low-rent cashing in.”
assert df.loc[(df["month"] >= "2021") & (df["month"] < "2022") ].comments.sum() == len(docdf)from sturdystats import Index
index = Index("Custom Analysis")
index.upload(df.to_dict("records"))
index.commit()
index.train()
# Ready to Explore
index.topicSearch()